Dell PowerConnect W-IAP92 Dell Instant 6.2.0.0-3.2.0.0 User Guide - Page 247
Mobility Trail, Association Time, Access Point
 |
View all Dell PowerConnect W-IAP92 manuals
Add to My Manuals
Save this manual to your list of manuals |
Page 247 highlights
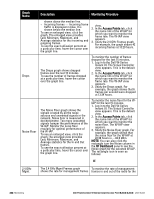
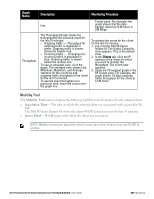
Graph Name Throughput Description Monitoring Procedure Trends pane. For example, the line. graph shows that the data transfer speed at 12:26 hours is 240 Mbps. The Throughput Graph shows the throughput for the selected client for the last 15 minutes. l Outgoing traffic - Throughput for outgoing traffic is displayed in green. Outgoing traffic is shown above the median line. l Incoming traffic - Throughput for incoming traffic is displayed in blue. Incoming traffic is shown below the median line. To see an enlarged view, click the graph. The enlarged view shows Last, Minimum, Maximum, and Average statistics for the incoming and outgoing traffic throughput of the client for the last 15 minutes. To see the exact throughput at a particular time, hover the cursor over the graph line. To monitor the errors for the client for the last 15 minutes, 1. Log in to the Dell W-Series Instant UI. The Virtual Controller view appears. This is the default view. 2. In the Clients tab, click the IP address of the client for which you want to monitor the throughput. The client view appears. 3. Study the Throughput graph in the RF Trends pane. For example, the graph shows 1.0 kbps outgoing traffic throughput for the client at 12:30 hours. Mobility Trail The Mobility Trail section displays the following mobility trail information for the selected client: l Association Time- The time at which the selected client was associated with a particular WIAP. The Dell W-Series Instant UI shows the client-W-IAP association over the last 15 minutes. l Access Point- W-IAP name with which the client was associated. NOTE: Mobility information about the client is reset each time it roams from one W-IAP to another. Dell PowerConnect W-Series Instant Access Point 6.2.0.0-3.2.0.0 | User Guide 247 | Monitoring
-
 1
1 -
2
-
3
-
4
-
5
-
6
-
7
-
8
-
9
-
10
-
11
-
12
-
13
-
14
-
15
-
16
-
17
-
18
-
19
-
20
-
21
-
22
-
23
-
24
-
25
-
26
-
27
-
28
-
29
-
30
-
31
-
32
-
33
-
34
-
35
-
36
-
37
-
38
-
39
-
40
-
41
-
42
-
43
-
44
-
45
-
46
-
47
-
48
-
49
-
50
-
51
-
52
-
53
-
54
-
55
-
56
-
57
-
58
-
59
-
60
-
61
-
62
-
63
-
64
-
65
-
66
-
67
-
68
-
69
-
70
-
71
-
72
-
73
-
74
-
75
-
76
-
77
-
78
-
79
-
80
-
81
-
82
-
83
-
84
-
85
-
86
-
87
-
88
-
89
-
90
-
91
-
92
-
93
-
94
-
95
-
96
-
97
-
98
-
99
-
100
-
101
-
102
-
103
-
104
-
105
-
106
-
107
-
108
-
109
-
110
-
111
-
112
-
113
-
114
-
115
-
116
-
117
-
118
-
119
-
120
-
121
-
122
-
123
-
124
-
125
-
126
-
127
-
128
-
129
-
130
-
131
-
132
-
133
-
134
-
135
-
136
-
137
-
138
-
139
-
140
-
141
-
142
-
143
-
144
-
145
-
146
-
147
-
148
-
149
-
150
-
151
-
152
-
153
-
154
-
155
-
156
-
157
-
158
-
159
-
160
-
161
-
162
-
163
-
164
-
165
-
166
-
167
-
168
-
169
-
170
-
171
-
172
-
173
-
174
-
175
-
176
-
177
-
178
-
179
-
180
-
181
-
182
-
183
-
184
-
185
-
186
-
187
-
188
-
189
-
190
-
191
-
192
-
193
-
194
-
195
-
196
-
197
-
198
-
199
-
200
-
201
-
202
-
203
-
204
-
205
-
206
-
207
-
208
-
209
-
210
-
211
-
212
-
213
-
214
-
215
-
216
-
217
-
218
-
219
-
220
-
221
-
222
-
223
-
224
-
225
-
226
-
227
-
228
-
229
-
230
-
231
-
232
-
233
-
234
-
235
-
236
-
237
-
238
-
239
-
240
-
241
-
 242
242 -
 243
243 -
 244
244 -
 245
245 -
 246
246 -
 247
247 -
 248
248 -
 249
249 -
 250
250 -
 251
251 -
 252
252 -
253
-
254
-
255
-
256
-
257
-
258
-
259
-
260
-
261
-
262
-
263
-
264
-
265
-
266
-
267
-
268
-
269
-
270
-
271
-
272
-
273
-
274
-
275
-
276
-
277
-
278
-
279
-
280
-
281
-
282
-
283
-
284
-
285
-
286
-
287
-
288
-
289
-
290
-
291
-
292
-
293
-
294
-
295
-
296
 |
 |