Dell PowerConnect W-IAP92 Dell Instant 6.2.0.0-3.2.0.0 User Guide - Page 34
RF Dashboard, Table 3
 |
View all Dell PowerConnect W-IAP92 manuals
Add to My Manuals
Save this manual to your list of manuals |
Page 34 highlights
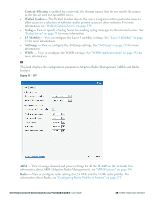
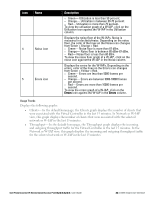
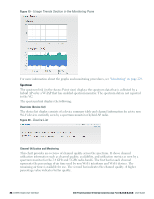
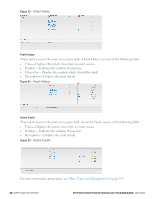
RF Dashboard Allows you to view trouble spots in the network. It displays the following information: Figure 18 - RF Dashboard in the Monitoring Pane The RF Dashboard displays the following information: l Clients- Lists the clients with low speed or signal strength in the network. l Access Points- Lists the W-IAPs whose utilization, noise, or errors are not within the specified threshold. The W-IAP names appear as links. When the W-IAP is clicked, the WIAP configuration information is displayed in the Info section. The RF Dashboard section is pushed to the bottom left corner of the Dell W-Series Instant UI. The RF Trends section appears in its place. This section consists of the Utilization, Band frames, Noise Floor, and Errors graphs. For more information on the graphs, see "Monitoring" on page 229. The following table lists the icons available on the RF Dashboard pane: Table 3- RF Dashboard Icons Icon Name 1 Signal Icon 2 Speed icon 3 Utilization icon Description Displays the signal strength of the client. Depending on the signal strength of the client, the color of the lines on the Signal bar changes from Green > Orange > Red. l Green- Signal strength is more than 20 decibels. l Orange- Signal strength is between 15-20 decibels. l Red- Signal strength is less than 15 decibels. To view the signal graph for a client, click on the signal icon against the client in the Signal column. Displays the data transfer speed of the client. Depending on the data transfer speed of the client, the color of the Signal bar changes from Green > Orange > Red. l Green- Data transfer speed is more than 50 percent of the maximum speed supported by the client. l Orange- Data transfer speed is between 25-50 percent of the maximum speed supported by the client. l Red- Data transfer speed is less than 25 percent of the maximum speed supported by the client. To view the data transfer speed graph of a client, click on the speed icon against the client in the Speed column. Displays the radio utilization rate of the IAPs. Depending on the percentage of utilization, the color of the lines on the Utilization icon changes from Green > Orange > Red. 34 | Dell W-Instant User Interface Dell PowerConnect W-Series Instant Access Point 6.2.0.0-3.2.0.0 | User Guide
-
 1
1 -
2
-
3
-
4
-
5
-
6
-
7
-
8
-
9
-
10
-
11
-
12
-
13
-
14
-
15
-
16
-
17
-
18
-
19
-
20
-
21
-
22
-
23
-
24
-
25
-
26
-
27
-
28
-
 29
29 -
 30
30 -
 31
31 -
 32
32 -
 33
33 -
 34
34 -
 35
35 -
 36
36 -
 37
37 -
 38
38 -
 39
39 -
40
-
41
-
42
-
43
-
44
-
45
-
46
-
47
-
48
-
49
-
50
-
51
-
52
-
53
-
54
-
55
-
56
-
57
-
58
-
59
-
60
-
61
-
62
-
63
-
64
-
65
-
66
-
67
-
68
-
69
-
70
-
71
-
72
-
73
-
74
-
75
-
76
-
77
-
78
-
79
-
80
-
81
-
82
-
83
-
84
-
85
-
86
-
87
-
88
-
89
-
90
-
91
-
92
-
93
-
94
-
95
-
96
-
97
-
98
-
99
-
100
-
101
-
102
-
103
-
104
-
105
-
106
-
107
-
108
-
109
-
110
-
111
-
112
-
113
-
114
-
115
-
116
-
117
-
118
-
119
-
120
-
121
-
122
-
123
-
124
-
125
-
126
-
127
-
128
-
129
-
130
-
131
-
132
-
133
-
134
-
135
-
136
-
137
-
138
-
139
-
140
-
141
-
142
-
143
-
144
-
145
-
146
-
147
-
148
-
149
-
150
-
151
-
152
-
153
-
154
-
155
-
156
-
157
-
158
-
159
-
160
-
161
-
162
-
163
-
164
-
165
-
166
-
167
-
168
-
169
-
170
-
171
-
172
-
173
-
174
-
175
-
176
-
177
-
178
-
179
-
180
-
181
-
182
-
183
-
184
-
185
-
186
-
187
-
188
-
189
-
190
-
191
-
192
-
193
-
194
-
195
-
196
-
197
-
198
-
199
-
200
-
201
-
202
-
203
-
204
-
205
-
206
-
207
-
208
-
209
-
210
-
211
-
212
-
213
-
214
-
215
-
216
-
217
-
218
-
219
-
220
-
221
-
222
-
223
-
224
-
225
-
226
-
227
-
228
-
229
-
230
-
231
-
232
-
233
-
234
-
235
-
236
-
237
-
238
-
239
-
240
-
241
-
242
-
243
-
244
-
245
-
246
-
247
-
248
-
249
-
250
-
251
-
252
-
253
-
254
-
255
-
256
-
257
-
258
-
259
-
260
-
261
-
262
-
263
-
264
-
265
-
266
-
267
-
268
-
269
-
270
-
271
-
272
-
273
-
274
-
275
-
276
-
277
-
278
-
279
-
280
-
281
-
282
-
283
-
284
-
285
-
286
-
287
-
288
-
289
-
290
-
291
-
292
-
293
-
294
-
295
-
296
 |
 |
