Dell PowerEdge XL 5133-4 Dell PowerEdge FTOS Command Line Reference Guide for - Page 248

Syntax, Parameters, Defaults, Command Modes, Command, History, Related
Page 248 highlights

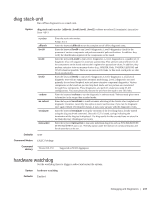
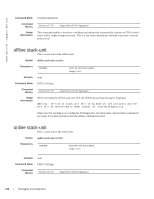
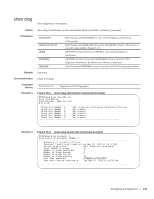
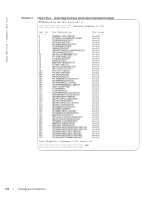
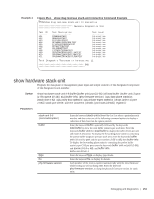
www.dell.com | support.dell.com • show hardware stack-unit • show hardware system-flow clear hardware stack-unit Clear statistics from selected hardware components. Syntax clear hardware stack-unit 0-5 {counters | unit 0-1 counters | cpu data-plane statistics | cpu party-bus statistics | stack-port 0-52} Parameters stack-unit 0-5 counters unit 0-0 counters cpu data-plane statistics cpu party-bus statistics stack-port 33-56 Enter the keyword stack-unit followed by 0 to 5 to select a particular stack member and then enter one of the following command options to clear a specific collection of data. Enter the keyword counters to clear the counters on the selected stack member. Enter the keyword unit along with a port-pipe number, from 0 to 1, followed by the keyword counters to clear the counters on the selected port-pipe. Enter the keywords cpu data-plane statistics to clear the data plane statistics. Enter the keywords cpu party-bus statistics to clear the management statistics. Enter the keyword stack-port followed by the port number of the stacking port to clear the statistics of the particular stacking port. Range: 33 to 56 Note: You can identify stack port numbers by physical inspection of the rear modules. The numbering is the same as for the 10G ports. You can also inspect the output of the show system stack-ports command. Defaults none Command Modes EXEC Privilege Command History Related Commands Version 8.3.17.0 show diag Supported on M I/O Aggregator Displays the data plane or management plane input and output statistics of the designated component of the designated stack member. 246 | Debugging and Diagnostics

  • 1
  • 2
  • 3
  • 4
  • 5
  • 6
  • 7
  • 8
  • 9
  • 10
  • 11
  • 12
  • 13
  • 14
  • 15
  • 16
  • 17
  • 18
  • 19
  • 20
  • 21
  • 22
  • 23
  • 24
  • 25
  • 26
  • 27
  • 28
  • 29
  • 30
  • 31
  • 32
  • 33
  • 34
  • 35
  • 36
  • 37
  • 38
  • 39
  • 40
  • 41
  • 42
  • 43
  • 44
  • 45
  • 46
  • 47
  • 48
  • 49
  • 50
  • 51
  • 52
  • 53
  • 54
  • 55
  • 56
  • 57
  • 58
  • 59
  • 60
  • 61
  • 62
  • 63
  • 64
  • 65
  • 66
  • 67
  • 68
  • 69
  • 70
  • 71
  • 72
  • 73
  • 74
  • 75
  • 76
  • 77
  • 78
  • 79
  • 80
  • 81
  • 82
  • 83
  • 84
  • 85
  • 86
  • 87
  • 88
  • 89
  • 90
  • 91
  • 92
  • 93
  • 94
  • 95
  • 96
  • 97
  • 98
  • 99
  • 100
  • 101
  • 102
  • 103
  • 104
  • 105
  • 106
  • 107
  • 108
  • 109
  • 110
  • 111
  • 112
  • 113
  • 114
  • 115
  • 116
  • 117
  • 118
  • 119
  • 120
  • 121
  • 122
  • 123
  • 124
  • 125
  • 126
  • 127
  • 128
  • 129
  • 130
  • 131
  • 132
  • 133
  • 134
  • 135
  • 136
  • 137
  • 138
  • 139
  • 140
  • 141
  • 142
  • 143
  • 144
  • 145
  • 146
  • 147
  • 148
  • 149
  • 150
  • 151
  • 152
  • 153
  • 154
  • 155
  • 156
  • 157
  • 158
  • 159
  • 160
  • 161
  • 162
  • 163
  • 164
  • 165
  • 166
  • 167
  • 168
  • 169
  • 170
  • 171
  • 172
  • 173
  • 174
  • 175
  • 176
  • 177
  • 178
  • 179
  • 180
  • 181
  • 182
  • 183
  • 184
  • 185
  • 186
  • 187
  • 188
  • 189
  • 190
  • 191
  • 192
  • 193
  • 194
  • 195
  • 196
  • 197
  • 198
  • 199
  • 200
  • 201
  • 202
  • 203
  • 204
  • 205
  • 206
  • 207
  • 208
  • 209
  • 210
  • 211
  • 212
  • 213
  • 214
  • 215
  • 216
  • 217
  • 218
  • 219
  • 220
  • 221
  • 222
  • 223
  • 224
  • 225
  • 226
  • 227
  • 228
  • 229
  • 230
  • 231
  • 232
  • 233
  • 234
  • 235
  • 236
  • 237
  • 238
  • 239
  • 240
  • 241
  • 242
  • 243
  • 244
  • 245
  • 246
  • 247
  • 248
  • 249
  • 250
  • 251
  • 252
  • 253
  • 254
  • 255
  • 256
  • 257
  • 258
  • 259
  • 260
  • 261
  • 262
  • 263
  • 264

246
|
Debugging and Diagnostics
www.dell.com | support.dell.com
show hardware stack-unit
show hardware system-flow
clear hardware stack-unit
Clear statistics from selected hardware components.
Syntax
clear hardware stack-unit
0–5
{
counters
|
unit
0–1
counters
|
cpu data-plane statistics
|
cpu
party-bus
statistics
|
stack-port
0–52
}
Parameters
Defaults
none
Command Modes
EXEC Privilege
Command
History
Related
Commands
stack-unit
0-5
Enter the keyword
stack-unit
followed by 0 to 5 to select a particular stack
member and then enter one of the following command options to clear a
specific collection of data.
counters
Enter the keyword
counters
to clear the counters on the selected stack
member.
unit
0–0
counters
Enter the keyword
unit
along with a port-pipe number, from
0
to
1
,
followed by the keyword
counters
to clear the counters on the selected
port-pipe.
cpu data-plane statistics
Enter the keywords
cpu data-plane statistics
to clear the data plane
statistics.
cpu party-bus statistics
Enter the keywords
cpu party-bus statistics
to clear the management
statistics.
stack-port
33–56
Enter the keyword
stack-port
followed by the port number of the stacking
port to clear the statistics of the particular stacking port.
Range: 33 to 56
Note
: You can identify stack port numbers by physical inspection of
the rear modules. The numbering is the same as for the 10G ports.
You can also inspect the output of the
show system stack-ports
command.
Version 8.3.17.0
Supported on M I/O Aggregator
show diag
Displays the data plane or management plane input and output statistics of the
designated component of the designated stack member.