Dell PowerEdge XL 5133-4 Dell PowerEdge FTOS Command Line Reference Guide for - Page 254
show hardware stack-unit phy-firmware-version Command Example, Defaults, Command Modes
 |
View all Dell PowerEdge XL 5133-4 manuals
Add to My Manuals
Save this manual to your list of manuals |
Page 254 highlights
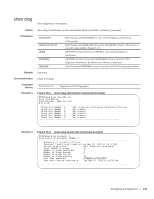
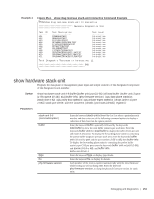
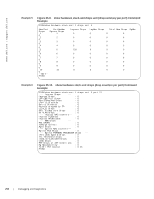
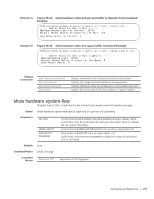
www.dell.com | support.dell.com cpu data-plane statistics cpu party-bus statistics cpu private-mgmt statistics drops [unit 0-0 [port 1-56]] stack-port 33-56 unit 0-0 {counters | details | port-stats [detail] | register} Enter the keywords cpu data-plane statistics, optionally followed by the keywords stack port and its number - 0 to 52 - to display the data plane statistics, which shows the High Gig (Higig) port raw input/output counter statistics to which the stacking module is connected. Enter the keywords cpu party-bus statistics, to display the Management plane input/output counter statistics of the pseudo party bus interface. Enter the keywords cpu private-mgmt statistics, to display the Management plane input/output counter statistics of the Private Management interface. Enter the drops keyword to display internal drops on the selected stack member. Optionally, use the unit keyword with 0 to select port-pipe 0, and then use port 1-56 to select a port on that port-pipe. Enter this keyword and a stacking port number to select a stacking port for which to display statistics. Identify the stack port number as you would to identify a 10G port that was in the same place in one of the rear modules. Note: You can identify stack port numbers by physical inspection of the rear modules. The numbering is the same as for the 10G ports. You can also inspect the output of the show system stack-ports command. Enter the unit keyword followed by 0 for port-pipe 0, and then enter one of the following keywords to troubleshoot errors on the selected port-pipe and to give status on why a port is not coming up to register level: counters, details, port-stats [detail], or register Defaults none Command Modes EXEC EXEC Privilege Command History Example 1 Version 8.3.17.0 Supported on M I/O Aggregator Figure 25-5. show hardware stack-unit phy-firmware-version Command Example FTOS#show hardware stack-unit 1 phy-firmware-version PortNumber Status Programmed Version SW Version 41 Present 01.05 01.05 42 Present 01.05 01.05 43 Present 01.05 01.05 44 Present 01.05 01.05 45 Not Present N/A N/A 46 Not Present N/A N/A 47 Not Present N/A N/A 48 Not Present N/A N/A 49 Present 01.06 01.06 50 Present 01.06 01.06 51 Present 01.06 01.06 52 Present 01.06 01.06 53 Present 01.06 01.06 54 Present 01.06 01.06 55 Present 01.06 01.06 56 Present 01.06 01.06 FTOS# 252 | Debugging and Diagnostics
-
 1
1 -
2
-
3
-
4
-
5
-
6
-
7
-
8
-
9
-
10
-
11
-
12
-
13
-
14
-
15
-
16
-
17
-
18
-
19
-
20
-
21
-
22
-
23
-
24
-
25
-
26
-
27
-
28
-
29
-
30
-
31
-
32
-
33
-
34
-
35
-
36
-
37
-
38
-
39
-
40
-
41
-
42
-
43
-
44
-
45
-
46
-
47
-
48
-
49
-
50
-
51
-
52
-
53
-
54
-
55
-
56
-
57
-
58
-
59
-
60
-
61
-
62
-
63
-
64
-
65
-
66
-
67
-
68
-
69
-
70
-
71
-
72
-
73
-
74
-
75
-
76
-
77
-
78
-
79
-
80
-
81
-
82
-
83
-
84
-
85
-
86
-
87
-
88
-
89
-
90
-
91
-
92
-
93
-
94
-
95
-
96
-
97
-
98
-
99
-
100
-
101
-
102
-
103
-
104
-
105
-
106
-
107
-
108
-
109
-
110
-
111
-
112
-
113
-
114
-
115
-
116
-
117
-
118
-
119
-
120
-
121
-
122
-
123
-
124
-
125
-
126
-
127
-
128
-
129
-
130
-
131
-
132
-
133
-
134
-
135
-
136
-
137
-
138
-
139
-
140
-
141
-
142
-
143
-
144
-
145
-
146
-
147
-
148
-
149
-
150
-
151
-
152
-
153
-
154
-
155
-
156
-
157
-
158
-
159
-
160
-
161
-
162
-
163
-
164
-
165
-
166
-
167
-
168
-
169
-
170
-
171
-
172
-
173
-
174
-
175
-
176
-
177
-
178
-
179
-
180
-
181
-
182
-
183
-
184
-
185
-
186
-
187
-
188
-
189
-
190
-
191
-
192
-
193
-
194
-
195
-
196
-
197
-
198
-
199
-
200
-
201
-
202
-
203
-
204
-
205
-
206
-
207
-
208
-
209
-
210
-
211
-
212
-
213
-
214
-
215
-
216
-
217
-
218
-
219
-
220
-
221
-
222
-
223
-
224
-
225
-
226
-
227
-
228
-
229
-
230
-
231
-
232
-
233
-
234
-
235
-
236
-
237
-
238
-
239
-
240
-
241
-
242
-
243
-
244
-
245
-
246
-
247
-
248
-
 249
249 -
 250
250 -
 251
251 -
 252
252 -
 253
253 -
 254
254 -
 255
255 -
 256
256 -
 257
257 -
 258
258 -
 259
259 -
260
-
261
-
262
-
263
-
264
 |
 |