Dell PowerEdge XL 5133-4 Dell PowerEdge FTOS Command Line Reference Guide for - Page 59
show memory, show processes cpu,
 |
View all Dell PowerEdge XL 5133-4 manuals
Add to My Manuals
Save this manual to your list of manuals |
Page 59 highlights
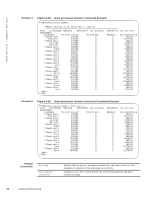
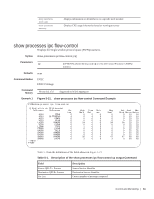
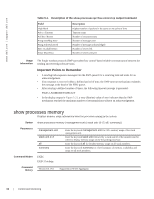
Related Commands show config (from INTERFACE VLAN mode) Displays information on a specific physical interface or virtual interface. show memory Displays current memory usage on the M I/O Aggregator. Syntax show memory [stack-unit 0-5] Parameters stack-unit 0-5 (OPTIONAL) Enter the keyword stack-unit followed by the stack unit ID of the stack member to display memory information on the designated stack member. Command Modes EXEC EXEC Privilege Command History Version 8.3.17.0 Supported on M I/O Aggregator Usage The output for the show memory command displays the memory usage of LP part (sysdlp) of the Information system. The Sysdlp is an aggregate task that handles all the tasks running on the CPU. Example Figure 5-15. show memory Command Example FTOS#show memory stack-unit 0 Statistics On Unit 0 Processor Total(b) Used(b) Free(b) 268435456 4010354 264425102 Lowest(b) 264375410 Largest(b) 264425102 show processes cpu Displays CPU usage information based on running processes. Syntax show processes cpu [management-unit 1-99 [details] | stack-unit 0-5 | summary | ipc | memory [stack-unit 0-5]] Parameters management-unit 1-99 [details] stack-unit 0-5 summary (OPTIONAL) Displays processes running in the control processor. The 1-99 variable sets the number of tasks to be displayed in order of the highest CPU usage in the past five (5) seconds. Add the details keyword to display all running processes (except sysdlp). See Example 3. (OPTIONAL) Enter the keyword stack-unit followed by the stack member ID (Range 0 to 5). As an option of show processes cpu, this option displays CPU usage for the designated stack member. See Example 2. Or, as an option of memory, this option limits the output of memory statistics to the designated stack member. See Example 5. (OPTIONAL) Enter the keyword summary to view a summary view of CPU usage for all members of the stack. See Example 1. Control and Monitoring | 57
-
 1
1 -
2
-
3
-
4
-
5
-
6
-
7
-
8
-
9
-
10
-
11
-
12
-
13
-
14
-
15
-
16
-
17
-
18
-
19
-
20
-
21
-
22
-
23
-
24
-
25
-
26
-
27
-
28
-
29
-
30
-
31
-
32
-
33
-
34
-
35
-
36
-
37
-
38
-
39
-
40
-
41
-
42
-
43
-
44
-
45
-
46
-
47
-
48
-
49
-
50
-
51
-
52
-
53
-
 54
54 -
 55
55 -
 56
56 -
 57
57 -
 58
58 -
 59
59 -
 60
60 -
 61
61 -
 62
62 -
 63
63 -
 64
64 -
65
-
66
-
67
-
68
-
69
-
70
-
71
-
72
-
73
-
74
-
75
-
76
-
77
-
78
-
79
-
80
-
81
-
82
-
83
-
84
-
85
-
86
-
87
-
88
-
89
-
90
-
91
-
92
-
93
-
94
-
95
-
96
-
97
-
98
-
99
-
100
-
101
-
102
-
103
-
104
-
105
-
106
-
107
-
108
-
109
-
110
-
111
-
112
-
113
-
114
-
115
-
116
-
117
-
118
-
119
-
120
-
121
-
122
-
123
-
124
-
125
-
126
-
127
-
128
-
129
-
130
-
131
-
132
-
133
-
134
-
135
-
136
-
137
-
138
-
139
-
140
-
141
-
142
-
143
-
144
-
145
-
146
-
147
-
148
-
149
-
150
-
151
-
152
-
153
-
154
-
155
-
156
-
157
-
158
-
159
-
160
-
161
-
162
-
163
-
164
-
165
-
166
-
167
-
168
-
169
-
170
-
171
-
172
-
173
-
174
-
175
-
176
-
177
-
178
-
179
-
180
-
181
-
182
-
183
-
184
-
185
-
186
-
187
-
188
-
189
-
190
-
191
-
192
-
193
-
194
-
195
-
196
-
197
-
198
-
199
-
200
-
201
-
202
-
203
-
204
-
205
-
206
-
207
-
208
-
209
-
210
-
211
-
212
-
213
-
214
-
215
-
216
-
217
-
218
-
219
-
220
-
221
-
222
-
223
-
224
-
225
-
226
-
227
-
228
-
229
-
230
-
231
-
232
-
233
-
234
-
235
-
236
-
237
-
238
-
239
-
240
-
241
-
242
-
243
-
244
-
245
-
246
-
247
-
248
-
249
-
250
-
251
-
252
-
253
-
254
-
255
-
256
-
257
-
258
-
259
-
260
-
261
-
262
-
263
-
264
 |
 |