McAfee MIS09EMB3RAA User Guide - Page 113

Tools, Traffic Monitor, Traffic Analysis, Refresh, Traffic Usage, Active Programs

Page 113 highlights

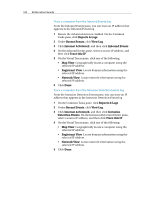
Chapter 20 McAfee Internet Security 111 Analyze inbound and outbound traffic The Traffic Analysis graph is a numerical and graphical representation of inbound and outbound Internet traffic. Also, the Traffic Monitor displays programs that use the most network connections on your computer and the IP addresses that the programs access. 1 Ensure that the Advanced Menu is enabled, and then click Tools. 2 On the Tools pane, click Traffic Monitor. 3 Under Traffic Monitor, click Traffic Analysis. Tip: To view the most up-to-date statistics, click Refresh under Traffic Analysis. Monitor program bandwidth You can view the pie chart, which displays the approximate percentage of bandwidth used by the most active programs on your computer during the past twenty-four hour period. The pie chart provides visual representation of the relative amounts of bandwidth used by the programs. 1 Ensure that the Advanced Menu is enabled, and then click Tools. 2 On the Tools pane, click Traffic Monitor. 3 Under Traffic Monitor, click Traffic Usage. Tip: To view the most up-to-date statistics, click Refresh under Traffic Usage. Monitor program activity You can view inbound and outbound program activity, which displays remote computer connections and ports. 1 Ensure that the Advanced Menu is enabled, and then click Tools. 2 On the Tools pane, click Traffic Monitor. 3 Under Traffic Monitor, click Active Programs. 4 You can view the following information: ƒ Program Activity graph: Select a program to display a graph of its activity. ƒ Listening connection: Select a Listening item under the program name. ƒ Computer connection: Select an IP address under the program name, system process, or service.

  • 1
  • 2
  • 3
  • 4
  • 5
  • 6
  • 7
  • 8
  • 9
  • 10
  • 11
  • 12
  • 13
  • 14
  • 15
  • 16
  • 17
  • 18
  • 19
  • 20
  • 21
  • 22
  • 23
  • 24
  • 25
  • 26
  • 27
  • 28
  • 29
  • 30
  • 31
  • 32
  • 33
  • 34
  • 35
  • 36
  • 37
  • 38
  • 39
  • 40
  • 41
  • 42
  • 43
  • 44
  • 45
  • 46
  • 47
  • 48
  • 49
  • 50
  • 51
  • 52
  • 53
  • 54
  • 55
  • 56
  • 57
  • 58
  • 59
  • 60
  • 61
  • 62
  • 63
  • 64
  • 65
  • 66
  • 67
  • 68
  • 69
  • 70
  • 71
  • 72
  • 73
  • 74
  • 75
  • 76
  • 77
  • 78
  • 79
  • 80
  • 81
  • 82
  • 83
  • 84
  • 85
  • 86
  • 87
  • 88
  • 89
  • 90
  • 91
  • 92
  • 93
  • 94
  • 95
  • 96
  • 97
  • 98
  • 99
  • 100
  • 101
  • 102
  • 103
  • 104
  • 105
  • 106
  • 107
  • 108
  • 109
  • 110
  • 111
  • 112
  • 113
  • 114
  • 115
  • 116
  • 117
  • 118
  • 119
  • 120
  • 121
  • 122
  • 123
  • 124
  • 125
  • 126
  • 127
  • 128
  • 129
  • 130
  • 131
  • 132
  • 133
  • 134
  • 135
  • 136
  • 137
  • 138
  • 139
  • 140
  • 141
  • 142
  • 143
  • 144
  • 145
  • 146
  • 147
  • 148
  • 149
  • 150
  • 151
  • 152
  • 153
  • 154
  • 155
  • 156
  • 157
  • 158
  • 159
  • 160
  • 161
  • 162
  • 163
  • 164
  • 165
  • 166
  • 167
  • 168
  • 169
  • 170
  • 171
  • 172
  • 173
  • 174
  • 175
  • 176
  • 177
  • 178
  • 179
  • 180
  • 181
  • 182
  • 183
  • 184
  • 185
  • 186
  • 187
  • 188
  • 189
  • 190
  • 191
  • 192
  • 193
  • 194
  • 195
  • 196
  • 197
  • 198
  • 199
  • 200
  • 201
  • 202
  • 203
  • 204
  • 205
  • 206
  • 207
  • 208
  • 209
  • 210
  • 211
  • 212
  • 213
  • 214
  • 215
  • 216
  • 217
  • 218
  • 219
  • 220
  • 221
  • 222
  • 223
  • 224
  • 225
  • 226
  • 227
  • 228
  • 229
  • 230
  • 231
  • 232
  • 233
  • 234
  • 235
  • 236
  • 237
  • 238
  • 239
  • 240
  • 241
  • 242
  • 243
  • 244
  • 245
  • 246
  • 247
  • 248
  • 249
  • 250
  • 251
  • 252
  • 253
  • 254
  • 255
  • 256
  • 257
  • 258
  • 259
  • 260
  • 261
  • 262
  • 263
  • 264
  • 265
  • 266
  • 267
  • 268
  • 269
  • 270
  • 271
  • 272
  • 273
  • 274

Chapter 20
McAfee Internet Security
111
Analyze inbound and outbound traffic
The Traffic Analysis graph is a numerical and graphical
representation of inbound and outbound Internet traffic. Also,
the Traffic Monitor displays programs that use the most network
connections on your computer and the IP addresses that the
programs access.
1
Ensure that the Advanced Menu is enabled, and then click
Tools
.
2
On the Tools pane, click
Traffic Monitor
.
3
Under
Traffic Monitor
, click
Traffic Analysis
.
Tip
: To view the most up-to-date statistics, click
Refresh
under
Traffic Analysis
.
Monitor program bandwidth
You can view the pie chart, which displays the approximate
percentage of bandwidth used by the most active programs on
your computer during the past twenty-four hour period. The pie
chart provides visual representation of the relative amounts of
bandwidth used by the programs.
1
Ensure that the Advanced Menu is enabled, and then click
Tools
.
2
On the Tools pane, click
Traffic Monitor
.
3
Under
Traffic Monitor
, click
Traffic Usage
.
Tip
: To view the most up-to-date statistics, click
Refresh
under
Traffic Usage
.
Monitor program activity
You can view inbound and outbound program activity, which
displays remote computer connections and ports.
1
Ensure that the Advanced Menu is enabled, and then click
Tools
.
2
On the Tools pane, click
Traffic Monitor
.
3
Under
Traffic Monitor
, click
Active Programs
.
4
You can view the following information:
Program Activity graph: Select a program to display a
graph of its activity.
Listening connection: Select a Listening item under the
program name.
Computer connection: Select an IP address under the
program name, system process, or service.