Konica Minolta AccurioPress C2070/2070P IC-314 User Guide - Page 102
Screening, Number of copies, Print, Insert the measurement chart into the FD-9
 |
View all Konica Minolta AccurioPress C2070/2070P manuals
Add to My Manuals
Save this manual to your list of manuals |
Page 102 highlights
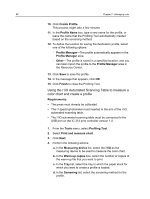
92 Chapter 7-Managing color d. In the Screening list, select the screening method for the profile. e. In the Number of copies box, select the number of copies of the chart that you want to print. 4. Click Print. The color measurement chart and warm-up file are printed. Note: If you print the color measurement chart on size A3 paper, two pages are printed. If you print the color measurement chart on size A4 or Letter, three pages are printed. 5. Insert the measurement chart into the FD-9 spectrophotometer. Make sure that you insert the pages in the correct order-page 1 first, followed by pages 2 and 3. The FD-9 spectrophotometer begins to scan each color bar.
-
 1
1 -
2
-
3
-
4
-
5
-
6
-
7
-
8
-
9
-
10
-
11
-
12
-
13
-
14
-
15
-
16
-
17
-
18
-
19
-
20
-
21
-
22
-
23
-
24
-
25
-
26
-
27
-
28
-
29
-
30
-
31
-
32
-
33
-
34
-
35
-
36
-
37
-
38
-
39
-
40
-
41
-
42
-
43
-
44
-
45
-
46
-
47
-
48
-
49
-
50
-
51
-
52
-
53
-
54
-
55
-
56
-
57
-
58
-
59
-
60
-
61
-
62
-
63
-
64
-
65
-
66
-
67
-
68
-
69
-
70
-
71
-
72
-
73
-
74
-
75
-
76
-
77
-
78
-
79
-
80
-
81
-
82
-
83
-
84
-
85
-
86
-
87
-
88
-
89
-
90
-
91
-
92
-
93
-
94
-
95
-
96
-
 97
97 -
 98
98 -
 99
99 -
 100
100 -
 101
101 -
 102
102 -
 103
103 -
 104
104 -
 105
105 -
 106
106 -
 107
107 -
108
-
109
-
110
-
111
-
112
-
113
-
114
-
115
-
116
-
117
-
118
-
119
-
120
-
121
-
122
-
123
-
124
-
125
-
126
-
127
-
128
-
129
-
130
-
131
-
132
-
133
-
134
-
135
-
136
-
137
-
138
-
139
-
140
-
141
-
142
-
143
-
144
-
145
-
146
-
147
-
148
-
149
-
150
-
151
-
152
-
153
-
154
-
155
-
156
-
157
-
158
-
159
-
160
-
161
-
162
-
163
-
164
-
165
-
166
-
167
-
168
-
169
-
170
-
171
-
172
-
173
-
174
-
175
-
176
-
177
-
178
-
179
-
180
-
181
-
182
-
183
-
184
-
185
-
186
-
187
-
188
-
189
-
190
-
191
-
192
-
193
-
194
-
195
-
196
-
197
-
198
-
199
-
200
-
201
-
202
-
203
-
204
-
205
-
206
-
207
-
208
-
209
-
210
-
211
-
212
-
213
-
214
-
215
-
216
-
217
-
218
-
219
-
220
-
221
-
222
-
223
-
224
-
225
-
226
-
227
-
228
-
229
-
230
-
231
-
232
-
233
-
234
-
235
-
236
-
237
-
238
-
239
-
240
-
241
-
242
-
243
-
244
-
245
-
246
-
247
-
248
-
249
-
250
-
251
-
252
-
253
-
254
-
255
-
256
-
257
-
258
-
259
-
260
-
261
-
262
-
263
-
264
-
265
-
266
-
267
-
268
-
269
-
270
-
271
-
272
-
273
-
274
-
275
-
276
-
277
-
278
-
279
-
280
-
281
 |
 |

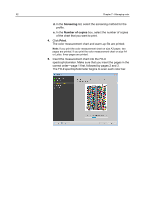
d.
In the
Screening
list, select the screening method for the
profile.
e.
In the
Number of copies
box, select the number of copies
of the chart that you want to print.
4.
Click
Print
.
The color measurement chart and warm-up file are printed.
Note:
If you print the color measurement chart on size A3 paper, two
pages are printed. If you print the color measurement chart on size A4
or Letter, three pages are printed.
5.
Insert the measurement chart into the FD-9
spectrophotometer. Make sure that you insert the pages in the
correct order—page 1 first, followed by pages 2 and 3.
The FD-9 spectrophotometer begins to scan each color bar.
92
Chapter 7—Managing color