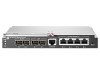
HP 6125G HP 6125G & 6125G/XG Blade Switches Layer 2 - LAN Switching Co - Page 13
Default level, Parameters, Description, Examples, interface-type, Fundamentals Configuration Guide
 |
View all HP 6125G manuals
Add to My Manuals
Save this manual to your list of manuals |
Page 13 highlights
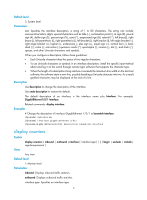
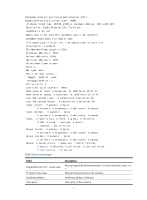
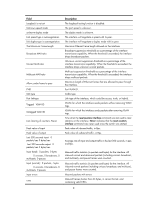
View Any view Default level 1: Monitor level Parameters inbound: Displays inbound traffic rate statistics. outbound: Displays outbound traffic rate statistics. interface-type: Specifies an interface type. |: Filters command output by specifying a regular expression. For more information about regular expressions, see Fundamentals Configuration Guide. begin: Displays the first line that matches the specified regular expression and all lines that follow. exclude: Displays all lines that do not match the specified regular expression. include: Displays all lines that match the specified regular expression. regular-expression: Specifies a regular expression, a case-sensitive string of 1 to 256 characters. Description Use display counters rate to display traffic rate statistics over the last sampling interval. The statistics cover only interfaces in up state. If an interface type is specified, the command displays traffic rate statistics for all up interfaces of the specified type. If no interface type is specified, the command displays traffic rate statistics for all up interfaces that have traffic counters. To set the statistics polling interval, use the flow-interval command. The default statistics polling interval is five minutes. Related commands: flow-interval. Examples # Display the inbound traffic rate statistics for all GigabitEthernet interfaces. display counters rate inbound interface gigabitethernet Interface Total(pkts/sec) Broadcast(pkts/sec) Multicast(pkts/sec) GE1/0/1 200 100 100 GE1/0/2 300 200 100 GE1/0/3 300 200 100 Overflow: more than 14 decimal digits. --: not supported. Table 2 Command output Field Interface Total (pkts/sec) Broadcast (pkts/sec) Description Abbreviated interface name. Average rate (in packets per second) of receiving or sending packets during the sampling interval. Average rate (packets per second) of receiving or sending broadcast packets during the sampling interval. 5
-
 1
1 -
2
-
3
-
4
-
5
-
6
-
7
-
 8
8 -
 9
9 -
 10
10 -
 11
11 -
 12
12 -
 13
13 -
 14
14 -
 15
15 -
 16
16 -
 17
17 -
 18
18 -
19
-
20
-
21
-
22
-
23
-
24
-
25
-
26
-
27
-
28
-
29
-
30
-
31
-
32
-
33
-
34
-
35
-
36
-
37
-
38
-
39
-
40
-
41
-
42
-
43
-
44
-
45
-
46
-
47
-
48
-
49
-
50
-
51
-
52
-
53
-
54
-
55
-
56
-
57
-
58
-
59
-
60
-
61
-
62
-
63
-
64
-
65
-
66
-
67
-
68
-
69
-
70
-
71
-
72
-
73
-
74
-
75
-
76
-
77
-
78
-
79
-
80
-
81
-
82
-
83
-
84
-
85
-
86
-
87
-
88
-
89
-
90
-
91
-
92
-
93
-
94
-
95
-
96
-
97
-
98
-
99
-
100
-
101
-
102
-
103
-
104
-
105
-
106
-
107
-
108
-
109
-
110
-
111
-
112
-
113
-
114
-
115
-
116
-
117
-
118
-
119
-
120
-
121
-
122
-
123
-
124
-
125
-
126
-
127
-
128
-
129
-
130
-
131
-
132
-
133
-
134
-
135
-
136
-
137
-
138
-
139
-
140
-
141
-
142
-
143
-
144
-
145
-
146
-
147
-
148
-
149
-
150
-
151
-
152
-
153
-
154
-
155
-
156
-
157
-
158
-
159
-
160
-
161
-
162
-
163
-
164
-
165
-
166
-
167
-
168
-
169
-
170
-
171
-
172
-
173
-
174
-
175
-
176
-
177
-
178
-
179
-
180
-
181
-
182
-
183
-
184
-
185
-
186
-
187
-
188
-
189
-
190
-
191
-
192
-
193
-
194
-
195
-
196
-
197
-
198
-
199
-
200
-
201
-
202
-
203
-
204
-
205
-
206
-
207
-
208
-
209
-
210
-
211
-
212
-
213
-
214
-
215
-
216
-
217
-
218
-
219
-
220
-
221
-
222
-
223
-
224
-
225
-
226
-
227
-
228
-
229
-
230
-
231
-
232
-
233
-
234
-
235
-
236
-
237
-
238
-
239
-
240
-
241
-
242
-
243
-
244
-
245
 |
 |
