Dell PowerVault NX3500 Administrator's Guide - Page 68
Network Performance, Client Network Throughput
 |
View all Dell PowerVault NX3500 manuals
Add to My Manuals
Save this manual to your list of manuals |
Page 68 highlights
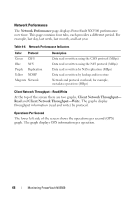
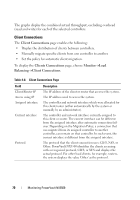
Network Performance The Network Performance page displays PowerVault NX3500 performance over time. This page contains four tabs, each provides a different period. For example, last day, last week, last month, and last year. Table 4-6. Network Performance Indicators Color Protocol Green CIFS Blue NFS Purple Replication Yellow NDMP Magenta Network Description Data read or written using the CIFS protocol (MBps) Data read or written using the NFS protocol (MBps) Data read or written by NAS replication (MBps) Data read or written by backup and/or restore Network and protocol overhead, for example, metadata operations (MBps) Client Network Throughput-Read/Write At the top of the screen there are two graphs, Client Network Throughput- Read and Client Network Throughput-Write. The graphs display throughput information (read and write) by protocol. Operations Per Second The lower left side of the screen shows the operations per second (OPS) graph. The graph displays OPS information per operation. 68 Monitoring PowerVault NX3500
-
 1
1 -
2
-
3
-
4
-
5
-
6
-
7
-
8
-
9
-
10
-
11
-
12
-
13
-
14
-
15
-
16
-
17
-
18
-
19
-
20
-
21
-
22
-
23
-
24
-
25
-
26
-
27
-
28
-
29
-
30
-
31
-
32
-
33
-
34
-
35
-
36
-
37
-
38
-
39
-
40
-
41
-
42
-
43
-
44
-
45
-
46
-
47
-
48
-
49
-
50
-
51
-
52
-
53
-
54
-
55
-
56
-
57
-
58
-
59
-
60
-
61
-
62
-
 63
63 -
 64
64 -
 65
65 -
 66
66 -
 67
67 -
 68
68 -
 69
69 -
 70
70 -
 71
71 -
 72
72 -
 73
73 -
74
-
75
-
76
-
77
-
78
-
79
-
80
-
81
-
82
-
83
-
84
-
85
-
86
-
87
-
88
-
89
-
90
-
91
-
92
-
93
-
94
-
95
-
96
-
97
-
98
-
99
-
100
-
101
-
102
-
103
-
104
-
105
-
106
-
107
-
108
-
109
-
110
-
111
-
112
-
113
-
114
-
115
-
116
-
117
-
118
-
119
-
120
-
121
-
122
-
123
-
124
-
125
-
126
-
127
-
128
-
129
-
130
-
131
-
132
-
133
-
134
-
135
-
136
-
137
-
138
-
139
-
140
-
141
-
142
-
143
-
144
-
145
-
146
-
147
-
148
-
149
-
150
-
151
-
152
-
153
-
154
-
155
-
156
-
157
-
158
-
159
-
160
-
161
-
162
-
163
-
164
-
165
-
166
-
167
-
168
-
169
-
170
-
171
-
172
-
173
-
174
-
175
-
176
-
177
-
178
-
179
-
180
-
181
-
182
-
183
-
184
-
185
-
186
-
187
-
188
-
189
-
190
-
191
-
192
-
193
-
194
-
195
-
196
-
197
-
198
 |
 |