Dell PowerVault NX3500 Administrator's Guide - Page 69
Load Balancing, Over Time
 |
View all Dell PowerVault NX3500 manuals
Add to My Manuals
Save this manual to your list of manuals |
Page 69 highlights
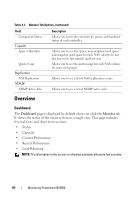
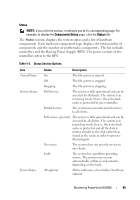
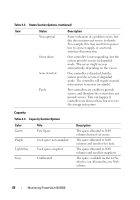
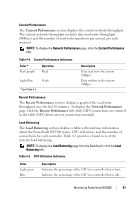
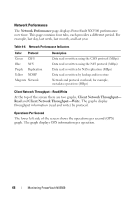
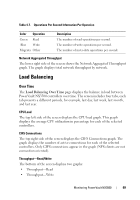
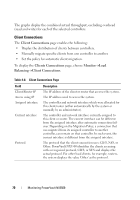
Table 4-7. Operations Per Second Information Per Operation Color Operation Green Read Blue Write Magenta Other Description The number of read operations per second. The number of write operations per second. The number of meta-data operations per second. Network Aggregated Throughput The lower right side of the screen shows the Network Aggregated Throughput graph. The graph displays total network throughput by network. Load Balancing Over Time The Load Balancing Over Time page displays the balance in load between PowerVault NX3500 controllers over time. The screen includes four tabs, each tab presents a different periods, for example, last day, last week, last month, and last year. CPU Load The top left side of the screen displays the CPU load graph. This graph displays the average CPU utilization in percentage for each of the selected controllers. CIFS Connections The top right side of the screen displays the CIFS Connections graph. The graph displays the number of active connections for each of the selected controllers. Only CIFS connections appear in the graph (NFS clients are not connection oriented). Throughput-Read/Write The bottom of the screen displays two graphs: • Throughput-Read • Throughput-Write Monitoring PowerVault NX3500 69
-
 1
1 -
2
-
3
-
4
-
5
-
6
-
7
-
8
-
9
-
10
-
11
-
12
-
13
-
14
-
15
-
16
-
17
-
18
-
19
-
20
-
21
-
22
-
23
-
24
-
25
-
26
-
27
-
28
-
29
-
30
-
31
-
32
-
33
-
34
-
35
-
36
-
37
-
38
-
39
-
40
-
41
-
42
-
43
-
44
-
45
-
46
-
47
-
48
-
49
-
50
-
51
-
52
-
53
-
54
-
55
-
56
-
57
-
58
-
59
-
60
-
61
-
62
-
63
-
 64
64 -
 65
65 -
 66
66 -
 67
67 -
 68
68 -
 69
69 -
 70
70 -
 71
71 -
 72
72 -
 73
73 -
 74
74 -
75
-
76
-
77
-
78
-
79
-
80
-
81
-
82
-
83
-
84
-
85
-
86
-
87
-
88
-
89
-
90
-
91
-
92
-
93
-
94
-
95
-
96
-
97
-
98
-
99
-
100
-
101
-
102
-
103
-
104
-
105
-
106
-
107
-
108
-
109
-
110
-
111
-
112
-
113
-
114
-
115
-
116
-
117
-
118
-
119
-
120
-
121
-
122
-
123
-
124
-
125
-
126
-
127
-
128
-
129
-
130
-
131
-
132
-
133
-
134
-
135
-
136
-
137
-
138
-
139
-
140
-
141
-
142
-
143
-
144
-
145
-
146
-
147
-
148
-
149
-
150
-
151
-
152
-
153
-
154
-
155
-
156
-
157
-
158
-
159
-
160
-
161
-
162
-
163
-
164
-
165
-
166
-
167
-
168
-
169
-
170
-
171
-
172
-
173
-
174
-
175
-
176
-
177
-
178
-
179
-
180
-
181
-
182
-
183
-
184
-
185
-
186
-
187
-
188
-
189
-
190
-
191
-
192
-
193
-
194
-
195
-
196
-
197
-
198
 |
 |