Oki B430d-beige PrintSuperVision 4.0 User Guide - Page 132
Supplies Usage Report
 |
View all Oki B430d-beige manuals
Add to My Manuals
Save this manual to your list of manuals |
Page 132 highlights
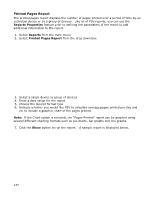
The toner changes report will be generated and sent to the recipient on the dates and times indicated. Note: For added convenience the Schedule Logs button located next to the Schedule button provides a quick way to see if/when the Toner Changes Report was generated and sent via email. 1. Click the Schedule Logs button 2. Indicate the desired date range 3. Select Toner Changes Report from the drop down menu 4. Click Show to run the status log Supplies Usage Report The Supplies Usage report displays current levels of toner as well as drum, transfer belt and fuser usage. The report can be created for a group of devices or a single device Report data can be displayed as an HTML table or chart Data can be imported into Excel Data can be presented in XML format The Supplies Usage report helps you to plan your supply purchases by predicting when consumables (supply items) will run out. A forecast report is also available that predicts the consumables that will be required over a period of time based on the current usage. 1. Select Reports from the main menu and Select Supplies Usage 2. Select an individual device or group of devices from the dropdown menu. 3. Select the Supplies you wish to view and the desired format of the report. 4. Click the Show button to run the report 132
-
 1
1 -
2
-
3
-
4
-
5
-
6
-
7
-
8
-
9
-
10
-
11
-
12
-
13
-
14
-
15
-
16
-
17
-
18
-
19
-
20
-
21
-
22
-
23
-
24
-
25
-
26
-
27
-
28
-
29
-
30
-
31
-
32
-
33
-
34
-
35
-
36
-
37
-
38
-
39
-
40
-
41
-
42
-
43
-
44
-
45
-
46
-
47
-
48
-
49
-
50
-
51
-
52
-
53
-
54
-
55
-
56
-
57
-
58
-
59
-
60
-
61
-
62
-
63
-
64
-
65
-
66
-
67
-
68
-
69
-
70
-
71
-
72
-
73
-
74
-
75
-
76
-
77
-
78
-
79
-
80
-
81
-
82
-
83
-
84
-
85
-
86
-
87
-
88
-
89
-
90
-
91
-
92
-
93
-
94
-
95
-
96
-
97
-
98
-
99
-
100
-
101
-
102
-
103
-
104
-
105
-
106
-
107
-
108
-
109
-
110
-
111
-
112
-
113
-
114
-
115
-
116
-
117
-
118
-
119
-
120
-
121
-
122
-
123
-
124
-
125
-
126
-
 127
127 -
 128
128 -
 129
129 -
 130
130 -
 131
131 -
 132
132 -
 133
133 -
 134
134 -
 135
135 -
 136
136 -
 137
137 -
138
-
139
-
140
-
141
-
142
-
143
-
144
-
145
-
146
-
147
-
148
-
149
-
150
-
151
-
152
-
153
-
154
-
155
-
156
-
157
-
158
-
159
-
160
-
161
-
162
-
163
-
164
-
165
-
166
-
167
-
168
-
169
-
170
-
171
-
172
-
173
-
174
-
175
-
176
-
177
-
178
-
179
-
180
-
181
-
182
-
183
-
184
-
185
-
186
-
187
-
188
-
189
-
190
-
191
-
192
-
193
-
194
-
195
-
196
-
197
 |
 |
