Oki B430d-beige PrintSuperVision 4.0 User Guide - Page 134
Change by Date
 |
View all Oki B430d-beige manuals
Add to My Manuals
Save this manual to your list of manuals |
Page 134 highlights
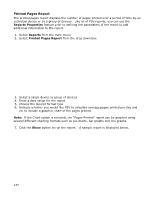
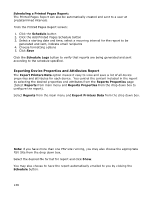
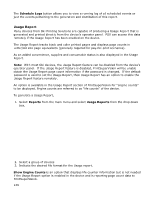
Change by Date: Indicates the anticipated date the supply item will run out Days Remaining: Indicates the anticipated number of days remaining before the supply item runs out Start Date: The date that PSV started monitoring the device Start Value: The consumable value recorded when PSV started monitoring the device Current Value: The consumable value recorded at the time the report is generated Maximum Count: Displays the maximum design value of the consumable. This value is used in calculating the remaining percentage of the consumables. Report if data is not older than XX days: Allows data from inactive devices to be filtered out Min. days for Forecast xx days: This value which by default is 7 days shows the consumables forecast for the number of days. If lower or higher number is desired, select a suitable value. Show if less than XX% or less than XX days: Prints values in red text to stress the importance of replacing supplies that are almost out. Use a higher value if you need more time to react. Use a lower value if you are only concerned with critical situations. 3. Click Show to run the Supplies Usage Report 134
-
 1
1 -
2
-
3
-
4
-
5
-
6
-
7
-
8
-
9
-
10
-
11
-
12
-
13
-
14
-
15
-
16
-
17
-
18
-
19
-
20
-
21
-
22
-
23
-
24
-
25
-
26
-
27
-
28
-
29
-
30
-
31
-
32
-
33
-
34
-
35
-
36
-
37
-
38
-
39
-
40
-
41
-
42
-
43
-
44
-
45
-
46
-
47
-
48
-
49
-
50
-
51
-
52
-
53
-
54
-
55
-
56
-
57
-
58
-
59
-
60
-
61
-
62
-
63
-
64
-
65
-
66
-
67
-
68
-
69
-
70
-
71
-
72
-
73
-
74
-
75
-
76
-
77
-
78
-
79
-
80
-
81
-
82
-
83
-
84
-
85
-
86
-
87
-
88
-
89
-
90
-
91
-
92
-
93
-
94
-
95
-
96
-
97
-
98
-
99
-
100
-
101
-
102
-
103
-
104
-
105
-
106
-
107
-
108
-
109
-
110
-
111
-
112
-
113
-
114
-
115
-
116
-
117
-
118
-
119
-
120
-
121
-
122
-
123
-
124
-
125
-
126
-
127
-
128
-
 129
129 -
 130
130 -
 131
131 -
 132
132 -
 133
133 -
 134
134 -
 135
135 -
 136
136 -
 137
137 -
 138
138 -
 139
139 -
140
-
141
-
142
-
143
-
144
-
145
-
146
-
147
-
148
-
149
-
150
-
151
-
152
-
153
-
154
-
155
-
156
-
157
-
158
-
159
-
160
-
161
-
162
-
163
-
164
-
165
-
166
-
167
-
168
-
169
-
170
-
171
-
172
-
173
-
174
-
175
-
176
-
177
-
178
-
179
-
180
-
181
-
182
-
183
-
184
-
185
-
186
-
187
-
188
-
189
-
190
-
191
-
192
-
193
-
194
-
195
-
196
-
197
 |
 |
