Oki B430d-beige PrintSuperVision 4.0 User Guide - Page 137
Printed s Report
 |
View all Oki B430d-beige manuals
Add to My Manuals
Save this manual to your list of manuals |
Page 137 highlights
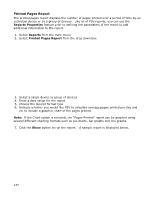
Printed Pages Report The printed pages report displays the number of pages printed over a period of time by an individual device or by a group of devices. Like all of PSV reports, you can use the Reports Properties feature prior to defining the parameters of the report to add additional information to the report. 1. Select Reports from the main menu 2. Select Printed Pages Report from the drop down box 3. Select a single device or group of devices 4. Enter a date range for the report 5. Choose the desired format type 6. Indicate whether you would like PSV to calculate average pages printed per day and /or to include a graph or chart of the pages printed. Note: If the Chart option is selected, the "Pages Printed" report can be graphed using several different charting formats such as pie charts, bar graphs and line graphs. 7. Click the Show button to run the report. A sample report is displayed below. 137
-
 1
1 -
2
-
3
-
4
-
5
-
6
-
7
-
8
-
9
-
10
-
11
-
12
-
13
-
14
-
15
-
16
-
17
-
18
-
19
-
20
-
21
-
22
-
23
-
24
-
25
-
26
-
27
-
28
-
29
-
30
-
31
-
32
-
33
-
34
-
35
-
36
-
37
-
38
-
39
-
40
-
41
-
42
-
43
-
44
-
45
-
46
-
47
-
48
-
49
-
50
-
51
-
52
-
53
-
54
-
55
-
56
-
57
-
58
-
59
-
60
-
61
-
62
-
63
-
64
-
65
-
66
-
67
-
68
-
69
-
70
-
71
-
72
-
73
-
74
-
75
-
76
-
77
-
78
-
79
-
80
-
81
-
82
-
83
-
84
-
85
-
86
-
87
-
88
-
89
-
90
-
91
-
92
-
93
-
94
-
95
-
96
-
97
-
98
-
99
-
100
-
101
-
102
-
103
-
104
-
105
-
106
-
107
-
108
-
109
-
110
-
111
-
112
-
113
-
114
-
115
-
116
-
117
-
118
-
119
-
120
-
121
-
122
-
123
-
124
-
125
-
126
-
127
-
128
-
129
-
130
-
131
-
 132
132 -
 133
133 -
 134
134 -
 135
135 -
 136
136 -
 137
137 -
 138
138 -
 139
139 -
 140
140 -
 141
141 -
 142
142 -
143
-
144
-
145
-
146
-
147
-
148
-
149
-
150
-
151
-
152
-
153
-
154
-
155
-
156
-
157
-
158
-
159
-
160
-
161
-
162
-
163
-
164
-
165
-
166
-
167
-
168
-
169
-
170
-
171
-
172
-
173
-
174
-
175
-
176
-
177
-
178
-
179
-
180
-
181
-
182
-
183
-
184
-
185
-
186
-
187
-
188
-
189
-
190
-
191
-
192
-
193
-
194
-
195
-
196
-
197
 |
 |
