Canon MultiPASS C635 User Manual - Page 128
Adjusting Histogram Tone Levels
 |
View all Canon MultiPASS C635 manuals
Add to My Manuals
Save this manual to your list of manuals |
Page 128 highlights
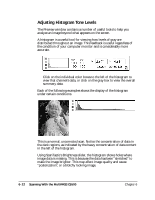
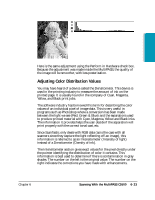
Adjusting Histogram Tone Levels The Preview window contains a number of useful tools to help you analyze an image beyond what appears on the screen. A histogram is a useful tool for viewing how levels of gray are distributed throughout an image. This feedback is useful regardless of the condition of your computer monitor and is considerably more accurate. ❍ Click on the individual color boxes to the left of the histogram to view that channel's data, or click on the gray box to view the overall summary data. Each of the following examples shows the display of the histogram under certain conditions. This is a normal, uncorrected scan. Notice the concentration of data in the dark regions, as indicated by the heavy concentration of data content in the left of the histogram. Using ScanTastic's Brightness slider, the histogram shows holes where image data is missing. This is because the data has been "stretched" to make the image brighter. This may affect image quality and cause "posterization", or a blotchy looking image. 6-22 Scanning With the MultiPASS C5500 Chapter 6
-
 1
1 -
2
-
3
-
4
-
5
-
6
-
7
-
8
-
9
-
10
-
11
-
12
-
13
-
14
-
15
-
16
-
17
-
18
-
19
-
20
-
21
-
22
-
23
-
24
-
25
-
26
-
27
-
28
-
29
-
30
-
31
-
32
-
33
-
34
-
35
-
36
-
37
-
38
-
39
-
40
-
41
-
42
-
43
-
44
-
45
-
46
-
47
-
48
-
49
-
50
-
51
-
52
-
53
-
54
-
55
-
56
-
57
-
58
-
59
-
60
-
61
-
62
-
63
-
64
-
65
-
66
-
67
-
68
-
69
-
70
-
71
-
72
-
73
-
74
-
75
-
76
-
77
-
78
-
79
-
80
-
81
-
82
-
83
-
84
-
85
-
86
-
87
-
88
-
89
-
90
-
91
-
92
-
93
-
94
-
95
-
96
-
97
-
98
-
99
-
100
-
101
-
102
-
103
-
104
-
105
-
106
-
107
-
108
-
109
-
110
-
111
-
112
-
113
-
114
-
115
-
116
-
117
-
118
-
119
-
120
-
121
-
122
-
 123
123 -
 124
124 -
 125
125 -
 126
126 -
 127
127 -
 128
128 -
 129
129 -
 130
130 -
 131
131 -
 132
132 -
 133
133 -
134
-
135
-
136
-
137
-
138
-
139
-
140
-
141
-
142
-
143
-
144
-
145
-
146
-
147
-
148
-
149
-
150
-
151
-
152
-
153
-
154
-
155
-
156
-
157
-
158
-
159
-
160
-
161
-
162
-
163
-
164
-
165
-
166
-
167
-
168
-
169
-
170
-
171
-
172
-
173
-
174
-
175
-
176
-
177
-
178
-
179
-
180
-
181
-
182
-
183
-
184
-
185
-
186
-
187
-
188
-
189
-
190
-
191
-
192
-
193
-
194
-
195
-
196
-
197
-
198
-
199
-
200
-
201
-
202
-
203
-
204
-
205
-
206
-
207
-
208
-
209
-
210
-
211
-
212
-
213
-
214
-
215
-
216
 |
 |
