HP 40gs HP 39gs_40gs_Mastering The Graphing Calculator_English_E_F2224-90010.p - Page 115
Sorting data, The STATS key, Functions of columns, lower quartile cutoffs.
 |
UPC - 882780045217
View all HP 40gs manuals
Add to My Manuals
Save this manual to your list of manuals |
Page 115 highlights
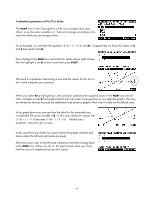
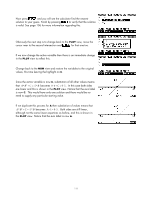
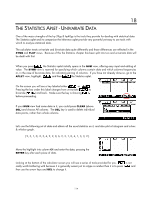
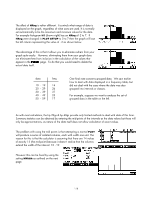
Sorting data The key labeled inserts space for a new number by shifting all the numbers down one space. does exactly what it says... it sorts the data into ascending or descending order. The extra fields in the screen shot right are used with bivariate sorts or frequency tables and will be explained in that section of the notes. Press to stop the sort. The key provides access to a larger font size and vs. we have already discussed. The last key labeled is the really useful one. The STATS key Making sure the highlight is in column C1, press the key and you will see the screen shown right. If you use the down arrow, you can scroll down and see the rest of the screen (below right). NOTE: If you get an error message instead of summary statistics, you may have forgotten to the aplet before beginning this process. If the SYMB view defines columns which don't actually have any data in them then errors will result. As you can see in the screens above right, the calculator gives not only the standard statistics that any scientific calculator would give, but also the minimum and maximum values, the median and the upper and lower quartile cutoffs. The mode is not given, but this is easily obtained from the histogram as we will see later. Functions of columns Let's create a second column of data with all its values exactly double the values in the first column. We can use the HOME view to avoid having to retype the values as follows... • Change to the HOME view and type the command shown right, then press ENTER. The command is found on the screen keys at the bottom of the screen. • Press the NUM key to change back to the NUM view. You should find your new column created and ready. If you now use the key, you will find that you still only see statistics for the first column (H1). The reason for this is that you have not set up the second column in the SYMB view. The default setup is to recognize column 1 as 'in use' and so we didn't need to do this before now. 115
-
 1
1 -
2
-
3
-
4
-
5
-
6
-
7
-
8
-
9
-
10
-
11
-
12
-
13
-
14
-
15
-
16
-
17
-
18
-
19
-
20
-
21
-
22
-
23
-
24
-
25
-
26
-
27
-
28
-
29
-
30
-
31
-
32
-
33
-
34
-
35
-
36
-
37
-
38
-
39
-
40
-
41
-
42
-
43
-
44
-
45
-
46
-
47
-
48
-
49
-
50
-
51
-
52
-
53
-
54
-
55
-
56
-
57
-
58
-
59
-
60
-
61
-
62
-
63
-
64
-
65
-
66
-
67
-
68
-
69
-
70
-
71
-
72
-
73
-
74
-
75
-
76
-
77
-
78
-
79
-
80
-
81
-
82
-
83
-
84
-
85
-
86
-
87
-
88
-
89
-
90
-
91
-
92
-
93
-
94
-
95
-
96
-
97
-
98
-
99
-
100
-
101
-
102
-
103
-
104
-
105
-
106
-
107
-
108
-
109
-
 110
110 -
 111
111 -
 112
112 -
 113
113 -
 114
114 -
 115
115 -
 116
116 -
 117
117 -
 118
118 -
 119
119 -
 120
120 -
121
-
122
-
123
-
124
-
125
-
126
-
127
-
128
-
129
-
130
-
131
-
132
-
133
-
134
-
135
-
136
-
137
-
138
-
139
-
140
-
141
-
142
-
143
-
144
-
145
-
146
-
147
-
148
-
149
-
150
-
151
-
152
-
153
-
154
-
155
-
156
-
157
-
158
-
159
-
160
-
161
-
162
-
163
-
164
-
165
-
166
-
167
-
168
-
169
-
170
-
171
-
172
-
173
-
174
-
175
-
176
-
177
-
178
-
179
-
180
-
181
-
182
-
183
-
184
-
185
-
186
-
187
-
188
-
189
-
190
-
191
-
192
-
193
-
194
-
195
-
196
-
197
-
198
-
199
-
200
-
201
-
202
-
203
-
204
-
205
-
206
-
207
-
208
-
209
-
210
-
211
-
212
-
213
-
214
-
215
-
216
-
217
-
218
-
219
-
220
-
221
-
222
-
223
-
224
-
225
-
226
-
227
-
228
-
229
-
230
-
231
-
232
-
233
-
234
-
235
-
236
-
237
-
238
-
239
-
240
-
241
-
242
-
243
-
244
-
245
-
246
-
247
-
248
-
249
-
250
-
251
-
252
-
253
-
254
-
255
-
256
-
257
-
258
-
259
-
260
-
261
-
262
-
263
-
264
-
265
-
266
-
267
-
268
-
269
-
270
-
271
-
272
-
273
-
274
-
275
-
276
-
277
-
278
-
279
-
280
-
281
-
282
-
283
-
284
-
285
-
286
-
287
-
288
-
289
-
290
-
291
-
292
-
293
-
294
-
295
-
296
-
297
-
298
-
299
-
300
-
301
-
302
-
303
-
304
-
305
-
306
-
307
-
308
-
309
-
310
-
311
-
312
-
313
-
314
-
315
-
316
-
317
-
318
-
319
-
320
-
321
-
322
-
323
-
324
-
325
-
326
-
327
-
328
-
329
-
330
-
331
-
332
-
333
-
334
-
335
-
336
-
337
-
338
-
339
-
340
-
341
-
342
-
343
-
344
-
345
-
346
-
347
-
348
-
349
-
350
-
351
-
352
-
353
-
354
-
355
-
356
-
357
-
358
-
359
-
360
-
361
-
362
-
363
-
364
-
365
-
366
 |
 |
