HP 40gs HP 39gs_40gs_Mastering The Graphing Calculator_English_E_F2224-90010.p - Page 126
Choosing from available fit models, Linear, Logarithmic, Exponential, Power, Quadratic, Cubic
 |
UPC - 882780045217
View all HP 40gs manuals
Add to My Manuals
Save this manual to your list of manuals |
Page 126 highlights
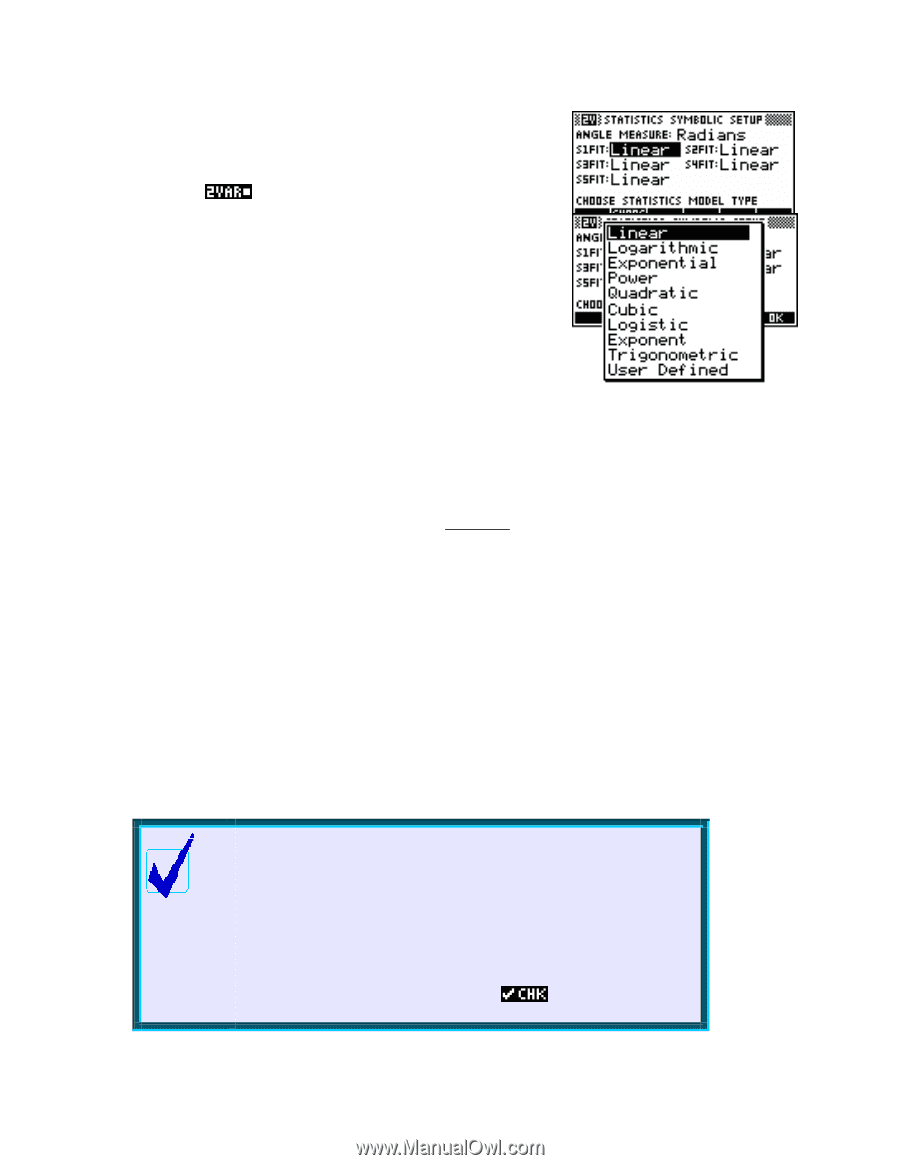
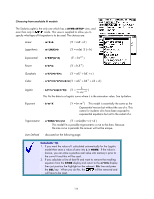
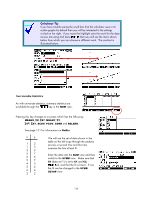
Choosing from available fit models The Statistics aplet is the only one which has a SYMB SETUP view, and even then only in mode. This view is supplied to allow you to specify what type of fit equation is to be used. The choices are: Linear - m*X+b (Y = mX + b ) Logarithmic - m*LN(X)+b (Y = m ln ( X ) + b ) Exponential - b*EXP(m*X) ( Y = b emX ) Power - b*X^m (Y = b X m) Quadratic - a*X^2+b*X+c (Y = aX 2 + bX + c ) Cubic - a*X^3+b*X^2+cX+d ( Y = aX 3 + bX 2 + cX + d ) Logistic - L/(1+a*exp(-b*X)) ( Y = 1 + L a e−bX ) This fits the data to a logistic curve where L is the saturation value. See tip below. Exponent - b*m^X ( Y = b× mX ) This model is essentially the same as the Exponential version but without the use of e. This caters for students who have been exposed to exponential equations but not to the extent of e. Trigonometric - a*SIN(b*X+c)+d ( Y = a sin(bx + c) + d ) This model fits a possible trigonometric curve to the data. Because the sine curve is periodic the answer will not be unique. User Defined - discussed on the following page. Calculator Tip 1. If you want the value of L calculated automatically for the Logistic model then store a value of zero into L in HOME. If the value is known, you can store a positive real value into memory L prior to the curve fit and this will be used. 2. If you calculate a line of best fit and want to remove the resulting equation from the SYMB display and return to the m*X+b display then just position the highlight on the relevant Fit: line and press the DEL key. When you do this, the will be removed and will have to be reset. 126
-
 1
1 -
2
-
3
-
4
-
5
-
6
-
7
-
8
-
9
-
10
-
11
-
12
-
13
-
14
-
15
-
16
-
17
-
18
-
19
-
20
-
21
-
22
-
23
-
24
-
25
-
26
-
27
-
28
-
29
-
30
-
31
-
32
-
33
-
34
-
35
-
36
-
37
-
38
-
39
-
40
-
41
-
42
-
43
-
44
-
45
-
46
-
47
-
48
-
49
-
50
-
51
-
52
-
53
-
54
-
55
-
56
-
57
-
58
-
59
-
60
-
61
-
62
-
63
-
64
-
65
-
66
-
67
-
68
-
69
-
70
-
71
-
72
-
73
-
74
-
75
-
76
-
77
-
78
-
79
-
80
-
81
-
82
-
83
-
84
-
85
-
86
-
87
-
88
-
89
-
90
-
91
-
92
-
93
-
94
-
95
-
96
-
97
-
98
-
99
-
100
-
101
-
102
-
103
-
104
-
105
-
106
-
107
-
108
-
109
-
110
-
111
-
112
-
113
-
114
-
115
-
116
-
117
-
118
-
119
-
120
-
 121
121 -
 122
122 -
 123
123 -
 124
124 -
 125
125 -
 126
126 -
 127
127 -
 128
128 -
 129
129 -
 130
130 -
 131
131 -
132
-
133
-
134
-
135
-
136
-
137
-
138
-
139
-
140
-
141
-
142
-
143
-
144
-
145
-
146
-
147
-
148
-
149
-
150
-
151
-
152
-
153
-
154
-
155
-
156
-
157
-
158
-
159
-
160
-
161
-
162
-
163
-
164
-
165
-
166
-
167
-
168
-
169
-
170
-
171
-
172
-
173
-
174
-
175
-
176
-
177
-
178
-
179
-
180
-
181
-
182
-
183
-
184
-
185
-
186
-
187
-
188
-
189
-
190
-
191
-
192
-
193
-
194
-
195
-
196
-
197
-
198
-
199
-
200
-
201
-
202
-
203
-
204
-
205
-
206
-
207
-
208
-
209
-
210
-
211
-
212
-
213
-
214
-
215
-
216
-
217
-
218
-
219
-
220
-
221
-
222
-
223
-
224
-
225
-
226
-
227
-
228
-
229
-
230
-
231
-
232
-
233
-
234
-
235
-
236
-
237
-
238
-
239
-
240
-
241
-
242
-
243
-
244
-
245
-
246
-
247
-
248
-
249
-
250
-
251
-
252
-
253
-
254
-
255
-
256
-
257
-
258
-
259
-
260
-
261
-
262
-
263
-
264
-
265
-
266
-
267
-
268
-
269
-
270
-
271
-
272
-
273
-
274
-
275
-
276
-
277
-
278
-
279
-
280
-
281
-
282
-
283
-
284
-
285
-
286
-
287
-
288
-
289
-
290
-
291
-
292
-
293
-
294
-
295
-
296
-
297
-
298
-
299
-
300
-
301
-
302
-
303
-
304
-
305
-
306
-
307
-
308
-
309
-
310
-
311
-
312
-
313
-
314
-
315
-
316
-
317
-
318
-
319
-
320
-
321
-
322
-
323
-
324
-
325
-
326
-
327
-
328
-
329
-
330
-
331
-
332
-
333
-
334
-
335
-
336
-
337
-
338
-
339
-
340
-
341
-
342
-
343
-
344
-
345
-
346
-
347
-
348
-
349
-
350
-
351
-
352
-
353
-
354
-
355
-
356
-
357
-
358
-
359
-
360
-
361
-
362
-
363
-
364
-
365
-
366
 |
 |