HP 40gs HP 39gs_40gs_Mastering The Graphing Calculator_English_E_F2224-90010.p - Page 321
Inequalities, Rectilinear Motion, Limits, The HP HOME View, y<fx
 |
UPC - 882780045217
View all HP 40gs manuals
Add to My Manuals
Save this manual to your list of manuals |
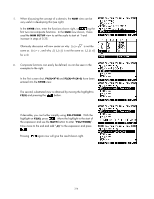
Page 321 highlights
Inequalities The topic of inequalities is one that is often included in calculus courses, particularly during the study of { } domains and this is usually extended to graphing intersecting regions such as ( x, y) : y ≤ 0.5x +1∩ y ≥ x2 −1 . Although the hp 39gs & hp 40gs do not have the in-built ability to plot inequalities, the process is easily handled using an aplet from The HP HOME View web site (at http://www.hphomeview.com) called "Inequations". This aplet allows the user to plot individual or overlapping inequalities but it will not handle functions of the form y
-
 1
1 -
2
-
3
-
4
-
5
-
6
-
7
-
8
-
9
-
10
-
11
-
12
-
13
-
14
-
15
-
16
-
17
-
18
-
19
-
20
-
21
-
22
-
23
-
24
-
25
-
26
-
27
-
28
-
29
-
30
-
31
-
32
-
33
-
34
-
35
-
36
-
37
-
38
-
39
-
40
-
41
-
42
-
43
-
44
-
45
-
46
-
47
-
48
-
49
-
50
-
51
-
52
-
53
-
54
-
55
-
56
-
57
-
58
-
59
-
60
-
61
-
62
-
63
-
64
-
65
-
66
-
67
-
68
-
69
-
70
-
71
-
72
-
73
-
74
-
75
-
76
-
77
-
78
-
79
-
80
-
81
-
82
-
83
-
84
-
85
-
86
-
87
-
88
-
89
-
90
-
91
-
92
-
93
-
94
-
95
-
96
-
97
-
98
-
99
-
100
-
101
-
102
-
103
-
104
-
105
-
106
-
107
-
108
-
109
-
110
-
111
-
112
-
113
-
114
-
115
-
116
-
117
-
118
-
119
-
120
-
121
-
122
-
123
-
124
-
125
-
126
-
127
-
128
-
129
-
130
-
131
-
132
-
133
-
134
-
135
-
136
-
137
-
138
-
139
-
140
-
141
-
142
-
143
-
144
-
145
-
146
-
147
-
148
-
149
-
150
-
151
-
152
-
153
-
154
-
155
-
156
-
157
-
158
-
159
-
160
-
161
-
162
-
163
-
164
-
165
-
166
-
167
-
168
-
169
-
170
-
171
-
172
-
173
-
174
-
175
-
176
-
177
-
178
-
179
-
180
-
181
-
182
-
183
-
184
-
185
-
186
-
187
-
188
-
189
-
190
-
191
-
192
-
193
-
194
-
195
-
196
-
197
-
198
-
199
-
200
-
201
-
202
-
203
-
204
-
205
-
206
-
207
-
208
-
209
-
210
-
211
-
212
-
213
-
214
-
215
-
216
-
217
-
218
-
219
-
220
-
221
-
222
-
223
-
224
-
225
-
226
-
227
-
228
-
229
-
230
-
231
-
232
-
233
-
234
-
235
-
236
-
237
-
238
-
239
-
240
-
241
-
242
-
243
-
244
-
245
-
246
-
247
-
248
-
249
-
250
-
251
-
252
-
253
-
254
-
255
-
256
-
257
-
258
-
259
-
260
-
261
-
262
-
263
-
264
-
265
-
266
-
267
-
268
-
269
-
270
-
271
-
272
-
273
-
274
-
275
-
276
-
277
-
278
-
279
-
280
-
281
-
282
-
283
-
284
-
285
-
286
-
287
-
288
-
289
-
290
-
291
-
292
-
293
-
294
-
295
-
296
-
297
-
298
-
299
-
300
-
301
-
302
-
303
-
304
-
305
-
306
-
307
-
308
-
309
-
310
-
311
-
312
-
313
-
314
-
315
-
 316
316 -
 317
317 -
 318
318 -
 319
319 -
 320
320 -
 321
321 -
 322
322 -
 323
323 -
 324
324 -
 325
325 -
 326
326 -
327
-
328
-
329
-
330
-
331
-
332
-
333
-
334
-
335
-
336
-
337
-
338
-
339
-
340
-
341
-
342
-
343
-
344
-
345
-
346
-
347
-
348
-
349
-
350
-
351
-
352
-
353
-
354
-
355
-
356
-
357
-
358
-
359
-
360
-
361
-
362
-
363
-
364
-
365
-
366
 |
 |
Inequalities
The topic of inequalities is one that is often included in calculus courses, particularly during the study of
≥
2
,
)
:
domains and this is usually extended to graphing intersecting regions such as
{
(
x y y
≤
0.5
x
+
1
∩
y
x
−
1
}
.
Although the hp 39gs & hp 40gs do not have the in-built ability to
plot inequalities, the process is easily handled using an aplet from
The HP HOME View
web site
(at
) called “Inequations”.
This aplet allows the user to plot individual or overlapping inequalities but it will not handle functions of the
form
y<f(x)
which require a dotted line.
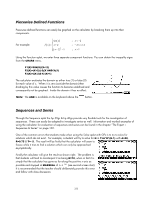
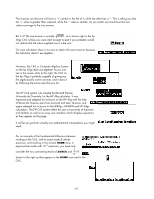
Rectilinear Motion
A topic which is commonly taught as part of any calculus course is rectilinear motion. This can be enhanced
by using the Parametric aplet to graphically illustrate the motion of a particle. If this is set up properly then it
can be a very helpful teaching aid, as the graph will slow down and speed up as it appears, illustrating the
velocity and acceleration of the particle.
See page 96 for a fully worked example of how the Parametric aplet
can be used to produce motion graphs of the form shown right. The
graph needs to be seen as it is being drawn to appreciate how the
particle slows down and speeds up as it passes the turning points.
Try it and see.
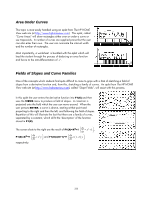
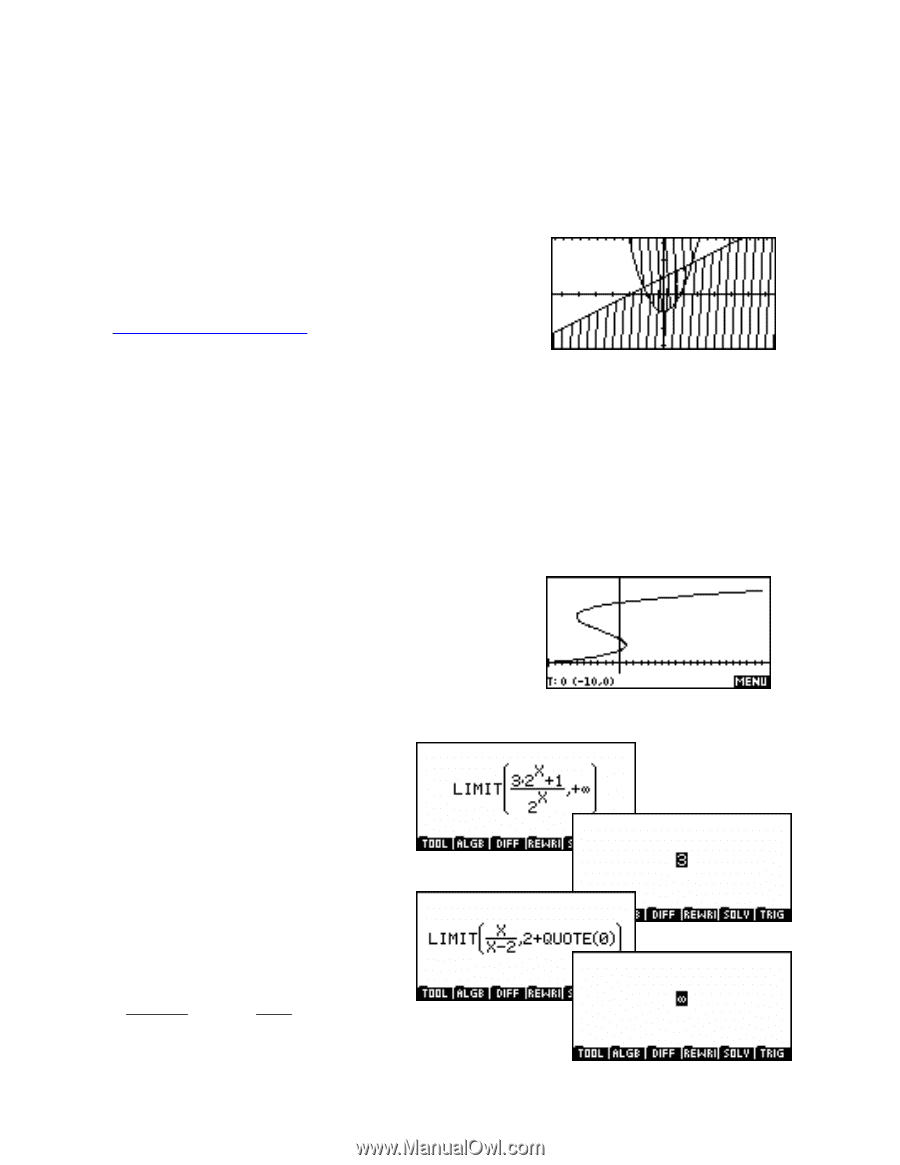
Limits
For information on exploration of limits in the
NUM view of the hp 39gs & hp 40gs and,
more importantly, the pitfalls that lie in wait for
the unwary, please read the information in the
chapter on page 80.
As can be seen right, f or those with an hp
40gs, limits can be evaluated in the CAS using
the LIMIT function. See page 343.
The examples shown right are for
×
x
lim
3
2
+
1
and
lim
x
.
x
x
→+∞
2
x
→
2
+
x
−
2
321