HP 40gs HP 39gs_40gs_Mastering The Graphing Calculator_English_E_F2224-90010.p - Page 81
→∞, ⎠
 |
UPC - 882780045217
View all HP 40gs manuals
Add to My Manuals
Save this manual to your list of manuals |
Page 81 highlights
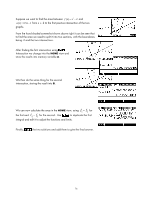
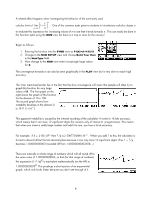
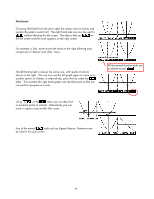
A related effect happens when investigating the behavior of the commonly used calculus limit of lim n→∞ ⎛⎜⎝1 + 1 n ⎞n ⎟ ⎠ . One of the common tasks given to students in introductory calculus classes is to evaluate this expression for increasing values of n to see that it tends towards e. This can easily be done in the Function aplet using the NUM view but there is a trap in store for the unwary! Begin as follows: 1. Entering the function into the SYMB view as F1(X)=(1+1/X)^X 2. Change to the NUM SETUP view and choose Build Your Own in the NumType field. 3. Now change to the NUM view enter increasingly large values for X. The convergence towards e can also be seen graphically in the PLOT view but is very slow to reach high accuracy. The 'trap' mentioned earlier lies in the fact that the slow convergence will mean that people will often try to graph this function for very large values of X. The first graph on the right shows the graph of this function for the domain of 0 to 100. The second graph shows how instability develops in the domain 0 to 1E11 (1×10¹¹ ). This apparent instability is caused by the internal rounding of the calculator. It works to 16 bits accuracy, which means that it can store 12 significant digits (for reasons only of interest to programmers). This means that when you invert a really large number and add it to one, you lose a lot of accuracy. For example, if X = 2 ⋅85×1010 then 1/X is 2 ⋅5087719298×10-11 . When you add 1 to this, the calculator is forced to discard all but the last decimal place because it can only store 12 significant digits. Thus 1 + 1/X becomes 1.00000000003 (rounded off from 1.00000000002508...) There are naturally a whole range of numbers which will all round off to the same value of 1.00000000003, so that (for that range of numbers) the expression (1+1/X)X is equivalent mathematically (on the HP) to 1.00000000003X. This produces a short section of an exponential graph, which only looks linear because you don't see enough of it. 81
-
 1
1 -
2
-
3
-
4
-
5
-
6
-
7
-
8
-
9
-
10
-
11
-
12
-
13
-
14
-
15
-
16
-
17
-
18
-
19
-
20
-
21
-
22
-
23
-
24
-
25
-
26
-
27
-
28
-
29
-
30
-
31
-
32
-
33
-
34
-
35
-
36
-
37
-
38
-
39
-
40
-
41
-
42
-
43
-
44
-
45
-
46
-
47
-
48
-
49
-
50
-
51
-
52
-
53
-
54
-
55
-
56
-
57
-
58
-
59
-
60
-
61
-
62
-
63
-
64
-
65
-
66
-
67
-
68
-
69
-
70
-
71
-
72
-
73
-
74
-
75
-
 76
76 -
 77
77 -
 78
78 -
 79
79 -
 80
80 -
 81
81 -
 82
82 -
 83
83 -
 84
84 -
 85
85 -
 86
86 -
87
-
88
-
89
-
90
-
91
-
92
-
93
-
94
-
95
-
96
-
97
-
98
-
99
-
100
-
101
-
102
-
103
-
104
-
105
-
106
-
107
-
108
-
109
-
110
-
111
-
112
-
113
-
114
-
115
-
116
-
117
-
118
-
119
-
120
-
121
-
122
-
123
-
124
-
125
-
126
-
127
-
128
-
129
-
130
-
131
-
132
-
133
-
134
-
135
-
136
-
137
-
138
-
139
-
140
-
141
-
142
-
143
-
144
-
145
-
146
-
147
-
148
-
149
-
150
-
151
-
152
-
153
-
154
-
155
-
156
-
157
-
158
-
159
-
160
-
161
-
162
-
163
-
164
-
165
-
166
-
167
-
168
-
169
-
170
-
171
-
172
-
173
-
174
-
175
-
176
-
177
-
178
-
179
-
180
-
181
-
182
-
183
-
184
-
185
-
186
-
187
-
188
-
189
-
190
-
191
-
192
-
193
-
194
-
195
-
196
-
197
-
198
-
199
-
200
-
201
-
202
-
203
-
204
-
205
-
206
-
207
-
208
-
209
-
210
-
211
-
212
-
213
-
214
-
215
-
216
-
217
-
218
-
219
-
220
-
221
-
222
-
223
-
224
-
225
-
226
-
227
-
228
-
229
-
230
-
231
-
232
-
233
-
234
-
235
-
236
-
237
-
238
-
239
-
240
-
241
-
242
-
243
-
244
-
245
-
246
-
247
-
248
-
249
-
250
-
251
-
252
-
253
-
254
-
255
-
256
-
257
-
258
-
259
-
260
-
261
-
262
-
263
-
264
-
265
-
266
-
267
-
268
-
269
-
270
-
271
-
272
-
273
-
274
-
275
-
276
-
277
-
278
-
279
-
280
-
281
-
282
-
283
-
284
-
285
-
286
-
287
-
288
-
289
-
290
-
291
-
292
-
293
-
294
-
295
-
296
-
297
-
298
-
299
-
300
-
301
-
302
-
303
-
304
-
305
-
306
-
307
-
308
-
309
-
310
-
311
-
312
-
313
-
314
-
315
-
316
-
317
-
318
-
319
-
320
-
321
-
322
-
323
-
324
-
325
-
326
-
327
-
328
-
329
-
330
-
331
-
332
-
333
-
334
-
335
-
336
-
337
-
338
-
339
-
340
-
341
-
342
-
343
-
344
-
345
-
346
-
347
-
348
-
349
-
350
-
351
-
352
-
353
-
354
-
355
-
356
-
357
-
358
-
359
-
360
-
361
-
362
-
363
-
364
-
365
-
366
 |
 |
