HP 40gs HP 39gs_40gs_Mastering The Graphing Calculator_English_E_F2224-90010.p - Page 137
Assigning rank orders to sets of data, Let us assume a set of 20 competitors in the 100
 |
UPC - 882780045217
View all HP 40gs manuals
Add to My Manuals
Save this manual to your list of manuals |
Page 137 highlights
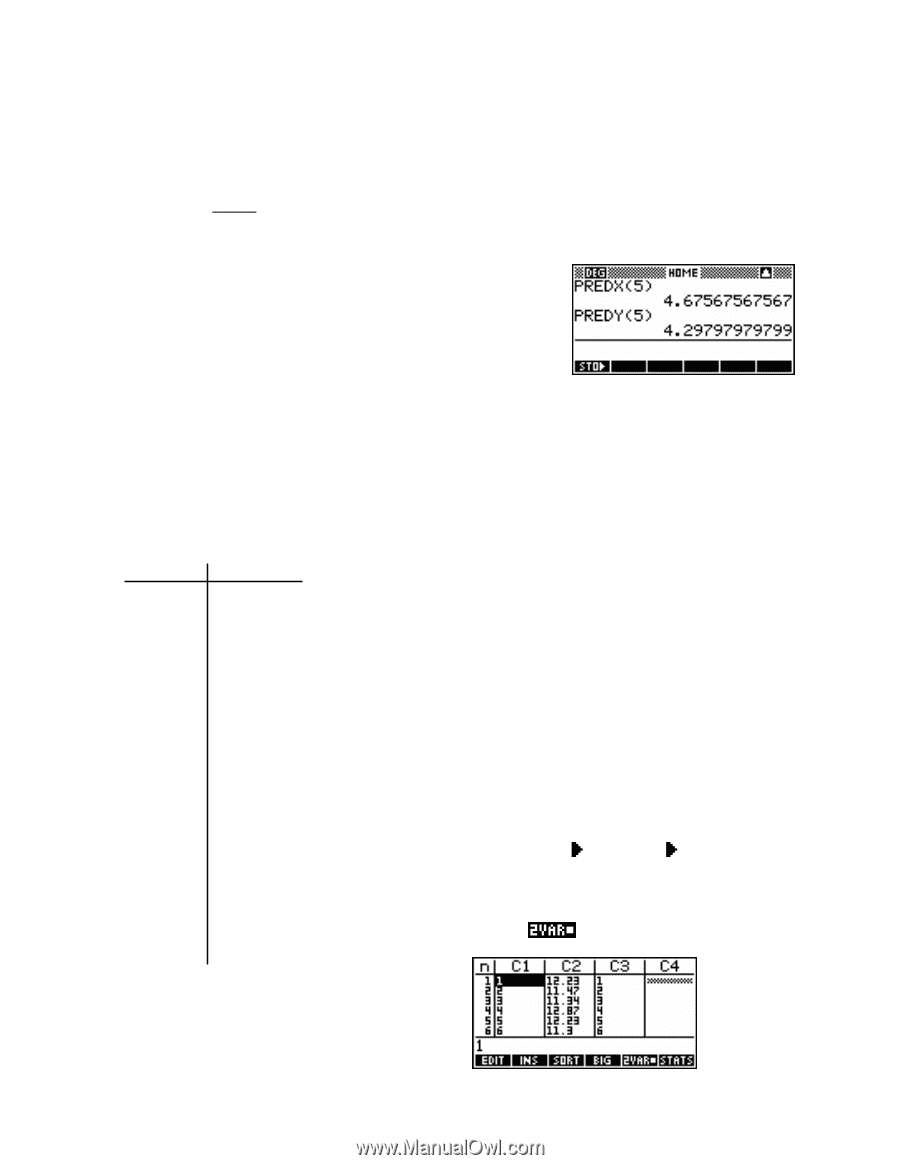
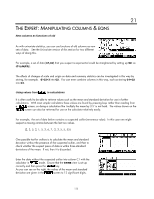
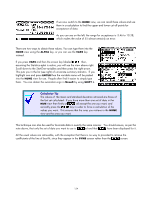
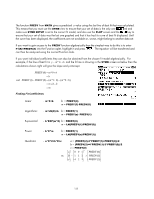
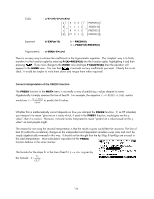
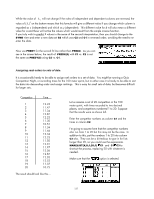
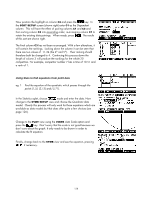
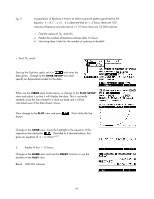
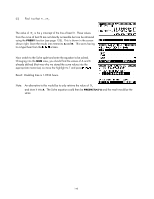
While the value of Sxy will not change if the roles of independent and dependent columns are reversed, the value of (Sx )2 on the bottom means that this formula will give a different value if you change which column is regarded as x (independent) and which as y (dependent). This different value for b will also mean a different value for a and these will not be the values which would result from the simple inverse function. If you truly wish to predict X values in the sense of the second interpretation, then you should change to the SYMB view and enter a new data set S2 which uses C2 and C1 in reversed order, avoiding the need to re enter the data. Now use PREDY for the second fit line rather than PREDX. As you can see in the screen below, the result of PREDX(5) with C1 vs. C2 is not the same as PREDY(5) using C2 vs. C1. Assigning rank orders to sets of data It is occasionally handy to be able to assign rank orders to a set of data. You might be running a Quiz Competition Night, or recording times for the 100 meter sprint, but in either case it is handy to be able to sort the data into descending order and assign rankings. This is easy for small sets of data, but becomes difficult for larger sets. Competitor Time 1 12.23 2 11.47 3 11.34 4 12.87 5 12.23 6 11.30 7 10.51 8 11.34 9 11.46 10 12.34 11 12.23 12 11.50 13 12.01 14 11.97 15 12.05 16 12.87 17 12.02 18 12.52 19 11.37 20 10.75 The result should look like this... Let us assume a set of 20 competitors in the 100 meter sprint, with times recorded to two decimal places, and competitors numbered 1 to 20. Suppose that the results were as shown left. Enter the competitor numbers as column C1 and the times in column C2. I'm going to assume here that the competitor numbers also run from 1 to 20 but this may not be the case. In addition to this, put the numbers 1 to 20 into column C3 also. They can be a bit tedious to type in for lists longer than 20, so you could use the expressions MAKELIST(X,X,1,20,1) C1 and C1 C3 to shortcut the process, replacing 20 with whatever is needed. Make sure that the option is selected. 137
-
 1
1 -
2
-
3
-
4
-
5
-
6
-
7
-
8
-
9
-
10
-
11
-
12
-
13
-
14
-
15
-
16
-
17
-
18
-
19
-
20
-
21
-
22
-
23
-
24
-
25
-
26
-
27
-
28
-
29
-
30
-
31
-
32
-
33
-
34
-
35
-
36
-
37
-
38
-
39
-
40
-
41
-
42
-
43
-
44
-
45
-
46
-
47
-
48
-
49
-
50
-
51
-
52
-
53
-
54
-
55
-
56
-
57
-
58
-
59
-
60
-
61
-
62
-
63
-
64
-
65
-
66
-
67
-
68
-
69
-
70
-
71
-
72
-
73
-
74
-
75
-
76
-
77
-
78
-
79
-
80
-
81
-
82
-
83
-
84
-
85
-
86
-
87
-
88
-
89
-
90
-
91
-
92
-
93
-
94
-
95
-
96
-
97
-
98
-
99
-
100
-
101
-
102
-
103
-
104
-
105
-
106
-
107
-
108
-
109
-
110
-
111
-
112
-
113
-
114
-
115
-
116
-
117
-
118
-
119
-
120
-
121
-
122
-
123
-
124
-
125
-
126
-
127
-
128
-
129
-
130
-
131
-
 132
132 -
 133
133 -
 134
134 -
 135
135 -
 136
136 -
 137
137 -
 138
138 -
 139
139 -
 140
140 -
 141
141 -
 142
142 -
143
-
144
-
145
-
146
-
147
-
148
-
149
-
150
-
151
-
152
-
153
-
154
-
155
-
156
-
157
-
158
-
159
-
160
-
161
-
162
-
163
-
164
-
165
-
166
-
167
-
168
-
169
-
170
-
171
-
172
-
173
-
174
-
175
-
176
-
177
-
178
-
179
-
180
-
181
-
182
-
183
-
184
-
185
-
186
-
187
-
188
-
189
-
190
-
191
-
192
-
193
-
194
-
195
-
196
-
197
-
198
-
199
-
200
-
201
-
202
-
203
-
204
-
205
-
206
-
207
-
208
-
209
-
210
-
211
-
212
-
213
-
214
-
215
-
216
-
217
-
218
-
219
-
220
-
221
-
222
-
223
-
224
-
225
-
226
-
227
-
228
-
229
-
230
-
231
-
232
-
233
-
234
-
235
-
236
-
237
-
238
-
239
-
240
-
241
-
242
-
243
-
244
-
245
-
246
-
247
-
248
-
249
-
250
-
251
-
252
-
253
-
254
-
255
-
256
-
257
-
258
-
259
-
260
-
261
-
262
-
263
-
264
-
265
-
266
-
267
-
268
-
269
-
270
-
271
-
272
-
273
-
274
-
275
-
276
-
277
-
278
-
279
-
280
-
281
-
282
-
283
-
284
-
285
-
286
-
287
-
288
-
289
-
290
-
291
-
292
-
293
-
294
-
295
-
296
-
297
-
298
-
299
-
300
-
301
-
302
-
303
-
304
-
305
-
306
-
307
-
308
-
309
-
310
-
311
-
312
-
313
-
314
-
315
-
316
-
317
-
318
-
319
-
320
-
321
-
322
-
323
-
324
-
325
-
326
-
327
-
328
-
329
-
330
-
331
-
332
-
333
-
334
-
335
-
336
-
337
-
338
-
339
-
340
-
341
-
342
-
343
-
344
-
345
-
346
-
347
-
348
-
349
-
350
-
351
-
352
-
353
-
354
-
355
-
356
-
357
-
358
-
359
-
360
-
361
-
362
-
363
-
364
-
365
-
366
 |
 |