HP 40gs HP 39gs_40gs_Mastering The Graphing Calculator_English_E_F2224-90010.p - Page 136
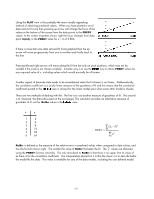
Correct interpretation of the PREDX function, function, would give me this y
 |
UPC - 882780045217
View all HP 40gs manuals
Add to My Manuals
Save this manual to your list of manuals |
Page 136 highlights
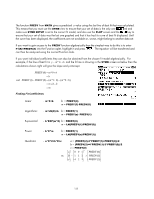
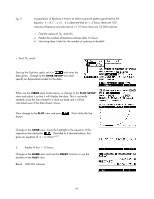
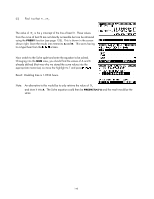
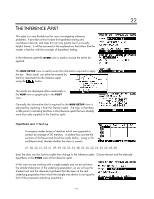
Cubic - a*X^3+b*X^2+cX+d ⎡a ⎤ ⎡ 0 0 0 1⎤−1 ⎡PREDY (0)⎤ ⎢⎢ b ⎢c ⎥ ⎥ ⎥ = ⎢ ⎢ ⎢ 1 8 1 4 1 2 1⎥⎥ 1⎥ × ⎢ ⎢ ⎢ PREDY (1) ⎥ ⎥ PREDY (2)⎥ ⎢⎢⎣d ⎥ ⎥⎦ ⎢⎢⎣27 9 3 1⎥⎥⎦ ⎢ ⎢ ⎣ PREDY (3) ⎥ ⎥⎦ Exponent - b*EXP(m*X) b = PREDY(0) m = PREDY(1)/PREDY(0) Trigonometric - a*SIN(b*X+c)+d There is no easy way to retrieve the coefficients in the trigonometric equation. The 'simplest' way is to firstly transfer it to the Function aplet by entering F1(X)=PREDY(X) into the Function aplet, highlighting it and then pressing . If you now change to the HOME view and type F1(QUOTE(X)) then the equation will appear in the HOME view. You can then it and edit out any coefficients you want. Clearly this is not ideal. It would be simpler to write them down and re-type them when required! Correct interpretation of the PREDX function The PREDX function in the MATH menu is not really a way of predicting x values despite its name. Algebraically it simply reverses the line of best fit. For example, the equation Yˆ = 0 ⋅8199X +1⋅1662 earlier would use Xˆ = (Y − 1.1662) to predict the X values. 0.8199 Whether this is mathematically correct depends on how you interpret the PREDX function. If, as HP intended, you interpret it to mean "give me an x value which, if used in the PREDY function, would give me this y value", then it is correct. However, it should not be interpreted to mean "predict an x value based on this y value" as most people might. The reason for not using the second interpretation is that the results it gives would then be incorrect. The line of best fit (unlike the correlation) changes as the independent and dependent variables swap roles and can't be simply algebraically reversed in this way. It should not be thought that the hp 39gs & hp40gs are unusual in this odd interpretation. Most calculators' equivalent of the PREDX function behave in the same manner. The formula for the slope b in the line of best fit yˆ = a + bx is given by the formula: b = S xy (Sx )2 . 136
-
 1
1 -
2
-
3
-
4
-
5
-
6
-
7
-
8
-
9
-
10
-
11
-
12
-
13
-
14
-
15
-
16
-
17
-
18
-
19
-
20
-
21
-
22
-
23
-
24
-
25
-
26
-
27
-
28
-
29
-
30
-
31
-
32
-
33
-
34
-
35
-
36
-
37
-
38
-
39
-
40
-
41
-
42
-
43
-
44
-
45
-
46
-
47
-
48
-
49
-
50
-
51
-
52
-
53
-
54
-
55
-
56
-
57
-
58
-
59
-
60
-
61
-
62
-
63
-
64
-
65
-
66
-
67
-
68
-
69
-
70
-
71
-
72
-
73
-
74
-
75
-
76
-
77
-
78
-
79
-
80
-
81
-
82
-
83
-
84
-
85
-
86
-
87
-
88
-
89
-
90
-
91
-
92
-
93
-
94
-
95
-
96
-
97
-
98
-
99
-
100
-
101
-
102
-
103
-
104
-
105
-
106
-
107
-
108
-
109
-
110
-
111
-
112
-
113
-
114
-
115
-
116
-
117
-
118
-
119
-
120
-
121
-
122
-
123
-
124
-
125
-
126
-
127
-
128
-
129
-
130
-
 131
131 -
 132
132 -
 133
133 -
 134
134 -
 135
135 -
 136
136 -
 137
137 -
 138
138 -
 139
139 -
 140
140 -
 141
141 -
142
-
143
-
144
-
145
-
146
-
147
-
148
-
149
-
150
-
151
-
152
-
153
-
154
-
155
-
156
-
157
-
158
-
159
-
160
-
161
-
162
-
163
-
164
-
165
-
166
-
167
-
168
-
169
-
170
-
171
-
172
-
173
-
174
-
175
-
176
-
177
-
178
-
179
-
180
-
181
-
182
-
183
-
184
-
185
-
186
-
187
-
188
-
189
-
190
-
191
-
192
-
193
-
194
-
195
-
196
-
197
-
198
-
199
-
200
-
201
-
202
-
203
-
204
-
205
-
206
-
207
-
208
-
209
-
210
-
211
-
212
-
213
-
214
-
215
-
216
-
217
-
218
-
219
-
220
-
221
-
222
-
223
-
224
-
225
-
226
-
227
-
228
-
229
-
230
-
231
-
232
-
233
-
234
-
235
-
236
-
237
-
238
-
239
-
240
-
241
-
242
-
243
-
244
-
245
-
246
-
247
-
248
-
249
-
250
-
251
-
252
-
253
-
254
-
255
-
256
-
257
-
258
-
259
-
260
-
261
-
262
-
263
-
264
-
265
-
266
-
267
-
268
-
269
-
270
-
271
-
272
-
273
-
274
-
275
-
276
-
277
-
278
-
279
-
280
-
281
-
282
-
283
-
284
-
285
-
286
-
287
-
288
-
289
-
290
-
291
-
292
-
293
-
294
-
295
-
296
-
297
-
298
-
299
-
300
-
301
-
302
-
303
-
304
-
305
-
306
-
307
-
308
-
309
-
310
-
311
-
312
-
313
-
314
-
315
-
316
-
317
-
318
-
319
-
320
-
321
-
322
-
323
-
324
-
325
-
326
-
327
-
328
-
329
-
330
-
331
-
332
-
333
-
334
-
335
-
336
-
337
-
338
-
339
-
340
-
341
-
342
-
343
-
344
-
345
-
346
-
347
-
348
-
349
-
350
-
351
-
352
-
353
-
354
-
355
-
356
-
357
-
358
-
359
-
360
-
361
-
362
-
363
-
364
-
365
-
366
 |
 |
