HP 40gs HP 39gs_40gs_Mastering The Graphing Calculator_English_E_F2224-90010.p - Page 62
The Expert: Working with Functions Effectively, Finding a suitable set of axes
 |
UPC - 882780045217
View all HP 40gs manuals
Add to My Manuals
Save this manual to your list of manuals |
Page 62 highlights
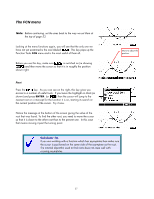
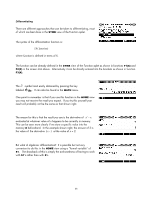
9 THE EXPERT: WORKING WITH FUNCTIONS EFFECTIVELY Finding a suitable set of axes This is probably the most frustrating aspect of graphical calculators for many users and there is unfortunately no simple answer. Part of the answer is to know your function - this is why we still expect you to learn mathematics instead of expecting the calculator to do it all! If you know, for example, that your function is hyperbolic then that immediately gives information about what to expect. If you don't have knowledge then here are a few tips: • Try plotting the function on the default axes. You may find that enough of the function is showing to give you a rough idea of how to adjust them to display it better. Remember that can work on either axis or on both. When in doubt, zoom out rather than in. See Tip #4 on the next page. • The NUM view can be very helpful. Try changing to NUM SETUP and setting the value of NumStep to 5 or even 10. Now scroll through the NUM view and look at what is happening to the F(X) values. Look for two things. o Firstly, where is the function most active? For what domain on the x axis is it changing rapidly both up and down? This is likely to be the domain you are most interested in. o Secondly, what is the range? What sort of values will you need to display on the y axis? Change to the PLOT SETUP view and set what you think may be appropriate axes. From those you can PLOT and then zoom in or out. • If the graph is part of a test or an examination then the wording of the question will often give a clue as to what x axis domain you should work with. You can then use Auto Scale. Auto Scale can be used to get a first approximation to a good set of axes. To do this you must choose your x axis domain first. Use your knowledge of what the function might look like, perhaps together with a quick scroll through the NUM view, to get an idea of what section of the x axis is important. For example, suppose a company's profit is modeled by the equation P ( x) = −100 + 50e−0.025x , where x is the x number of items manufactured. Suppose that from the context of the question it is clear that we are mainly interested in the domain 0 ≤ x ≤ 100 . After entering the equation into the SYMB view, change into the NUM SETUP view and set the numeric scale to start at zero and increment in steps of 10 (or 5 if you want more details). 62
-
 1
1 -
2
-
3
-
4
-
5
-
6
-
7
-
8
-
9
-
10
-
11
-
12
-
13
-
14
-
15
-
16
-
17
-
18
-
19
-
20
-
21
-
22
-
23
-
24
-
25
-
26
-
27
-
28
-
29
-
30
-
31
-
32
-
33
-
34
-
35
-
36
-
37
-
38
-
39
-
40
-
41
-
42
-
43
-
44
-
45
-
46
-
47
-
48
-
49
-
50
-
51
-
52
-
53
-
54
-
55
-
56
-
 57
57 -
 58
58 -
 59
59 -
 60
60 -
 61
61 -
 62
62 -
 63
63 -
 64
64 -
 65
65 -
 66
66 -
 67
67 -
68
-
69
-
70
-
71
-
72
-
73
-
74
-
75
-
76
-
77
-
78
-
79
-
80
-
81
-
82
-
83
-
84
-
85
-
86
-
87
-
88
-
89
-
90
-
91
-
92
-
93
-
94
-
95
-
96
-
97
-
98
-
99
-
100
-
101
-
102
-
103
-
104
-
105
-
106
-
107
-
108
-
109
-
110
-
111
-
112
-
113
-
114
-
115
-
116
-
117
-
118
-
119
-
120
-
121
-
122
-
123
-
124
-
125
-
126
-
127
-
128
-
129
-
130
-
131
-
132
-
133
-
134
-
135
-
136
-
137
-
138
-
139
-
140
-
141
-
142
-
143
-
144
-
145
-
146
-
147
-
148
-
149
-
150
-
151
-
152
-
153
-
154
-
155
-
156
-
157
-
158
-
159
-
160
-
161
-
162
-
163
-
164
-
165
-
166
-
167
-
168
-
169
-
170
-
171
-
172
-
173
-
174
-
175
-
176
-
177
-
178
-
179
-
180
-
181
-
182
-
183
-
184
-
185
-
186
-
187
-
188
-
189
-
190
-
191
-
192
-
193
-
194
-
195
-
196
-
197
-
198
-
199
-
200
-
201
-
202
-
203
-
204
-
205
-
206
-
207
-
208
-
209
-
210
-
211
-
212
-
213
-
214
-
215
-
216
-
217
-
218
-
219
-
220
-
221
-
222
-
223
-
224
-
225
-
226
-
227
-
228
-
229
-
230
-
231
-
232
-
233
-
234
-
235
-
236
-
237
-
238
-
239
-
240
-
241
-
242
-
243
-
244
-
245
-
246
-
247
-
248
-
249
-
250
-
251
-
252
-
253
-
254
-
255
-
256
-
257
-
258
-
259
-
260
-
261
-
262
-
263
-
264
-
265
-
266
-
267
-
268
-
269
-
270
-
271
-
272
-
273
-
274
-
275
-
276
-
277
-
278
-
279
-
280
-
281
-
282
-
283
-
284
-
285
-
286
-
287
-
288
-
289
-
290
-
291
-
292
-
293
-
294
-
295
-
296
-
297
-
298
-
299
-
300
-
301
-
302
-
303
-
304
-
305
-
306
-
307
-
308
-
309
-
310
-
311
-
312
-
313
-
314
-
315
-
316
-
317
-
318
-
319
-
320
-
321
-
322
-
323
-
324
-
325
-
326
-
327
-
328
-
329
-
330
-
331
-
332
-
333
-
334
-
335
-
336
-
337
-
338
-
339
-
340
-
341
-
342
-
343
-
344
-
345
-
346
-
347
-
348
-
349
-
350
-
351
-
352
-
353
-
354
-
355
-
356
-
357
-
358
-
359
-
360
-
361
-
362
-
363
-
364
-
365
-
366
 |
 |
