Casio CFX-9800G-w Owners Manual - Page 116
gCoord, ECoord, Coord, Important, X=-2.76, Graeh, Range
 |
UPC - 079767128685
View all Casio CFX-9800G-w manuals
Add to My Manuals
Save this manual to your list of manuals |
Page 116 highlights
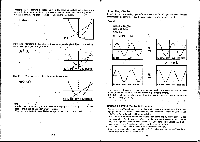
Move the pointer using O►. and ®. Holding down either key moves the pointer at, high speed. Move the pointer to the first intersection. - When the pointer is at the location you want, press g(Coord) to view coordinates individually. Each press of g(Coord) changes the coordinate display in the sequence shown below. 0 -0 X/Y coordinates- Kr-2.165951 Y=4.1659514 E(Coord) X coordinate only- X=-2.76 957446 Fe (Coord) V coordinate only W .7659 7446 Important The pointer does not move at fixed intervals. It follows the dots on the display. Because of this, the values provided for coordinates are approximate' Move the pointer to the next intersection. ® 0 -196- Y=0.191489362 You camthen use.R(Coord) to view the x and y coordinate values. laCoord) Kr1.9095106 Yr0.1914993 Finally, press g(Trace) again to exit the Trace Function. *To move the trace between two graphs This operation can be used to trace multiple graphs on.the same display. In'the COMP, SD, REG, MAT or TABLE Mode this operation can be used with up to six graphs that are layered using multi-statements or programming. In the GRAPH Mode, all graphs that are drawn on the display can be traced. Example To trace points on the following equations (using a multistatement): y= (x+ 2)(x- 3) Y= 2x - 3 Use the following range parameters: Graeh Range scl: 1 Ymin: -10 max 10 .: scl: 2 FirfWG Execute the multistathment that draws the two graphs. I(SET)El(REC) 1ED g(cLs)g 911:11T1 MID EIFOCIEJ CIS -197-
-
 1
1 -
2
-
3
-
4
-
5
-
6
-
7
-
8
-
9
-
10
-
11
-
12
-
13
-
14
-
15
-
16
-
17
-
18
-
19
-
20
-
21
-
22
-
23
-
24
-
25
-
26
-
27
-
28
-
29
-
30
-
31
-
32
-
33
-
34
-
35
-
36
-
37
-
38
-
39
-
40
-
41
-
42
-
43
-
44
-
45
-
46
-
47
-
48
-
49
-
50
-
51
-
52
-
53
-
54
-
55
-
56
-
57
-
58
-
59
-
60
-
61
-
62
-
63
-
64
-
65
-
66
-
67
-
68
-
69
-
70
-
71
-
72
-
73
-
74
-
75
-
76
-
77
-
78
-
79
-
80
-
81
-
82
-
83
-
84
-
85
-
86
-
87
-
88
-
89
-
90
-
91
-
92
-
93
-
94
-
95
-
96
-
97
-
98
-
99
-
100
-
101
-
102
-
103
-
104
-
105
-
106
-
107
-
108
-
109
-
110
-
 111
111 -
 112
112 -
 113
113 -
 114
114 -
 115
115 -
 116
116 -
 117
117 -
 118
118 -
 119
119 -
 120
120 -
 121
121 -
122
-
123
-
124
-
125
-
126
-
127
-
128
-
129
-
130
-
131
-
132
-
133
-
134
-
135
-
136
-
137
-
138
-
139
-
140
-
141
-
142
-
143
-
144
-
145
-
146
-
147
-
148
-
149
-
150
-
151
-
152
-
153
-
154
-
155
-
156
-
157
-
158
-
159
-
160
-
161
-
162
-
163
-
164
-
165
-
166
-
167
-
168
-
169
-
170
-
171
-
172
-
173
-
174
-
175
-
176
-
177
-
178
-
179
-
180
-
181
-
182
-
183
-
184
-
185
-
186
-
187
-
188
-
189
-
190
-
191
-
192
-
193
-
194
-
195
-
196
-
197
-
198
-
199
-
200
-
201
-
202
-
203
-
204
-
205
-
206
 |
 |
