Casio CFX-9800G-w Owners Manual - Page 157
Casio CFX-9800G-w - Color Graphing Calculator Manual
 |
UPC - 079767128685
View all Casio CFX-9800G-w manuals
Add to My Manuals
Save this manual to your list of manuals |
Page 157 highlights
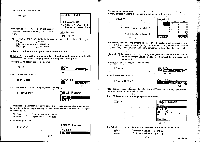
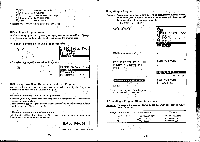
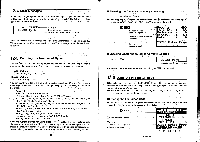
• To edit the recursion formula Example To change the formula from a,, = + 1 to a„-= 2n - 3: an =2n +1 _ W/DIEMIKI an=2n -3_ _I E an=2n -3 n Ear, 3 3 3 FREE, mew •The table that appears shows values that are calculated using the new formula. • To delete the formula and table data for new input While the table function menu is displayed, press E(ERS). Ex (ERS) I'M rtrul RASE TfIBLE? Press E (YES) to delete all the table's data and the formula, or. Fe (NO) to abort the operation without deleting anything. • Drawing a Graph Using Table Data There are two types of graph you can draw using table data. A connected-point graph can be drawn using the formula,stored in memory. A plotted-point graph can be drawn plotting only the points of the values in the table, without connecting them. • Specifying the Y-Axis and X-Axis for .the Graph You specify either of the two follbwing conditions for the x-axis and y-axis of the graph. y-axis .= a, ; x-axis = n y-axis = Ea„ ; x-axis = n • To specify the x-axis and y axis While the table function menu is shown, press Fs (G•CN) or g(G•PL) to display the axis specification menu. E (a.) Ll(Ea„) kir ,. SELECT TYPE In E E y-axis = a, ; x-axis = y-axis = Ea„ ; x-axis = • To draw a connected-point graph Example To draw a connected-point graph of a, = 2n + 1, with y-axis = a„ and x-axis = n. Use the following range parameters: Specify a connected-point graph. El(G-CNI) Graph Range Oitn1:19 max: sc1:1 Ymin:U max: 13 scl: 1 roiTinrE I n SELECT TYPE rEVi - 278 -- - 279 -
-
 1
1 -
2
-
3
-
4
-
5
-
6
-
7
-
8
-
9
-
10
-
11
-
12
-
13
-
14
-
15
-
16
-
17
-
18
-
19
-
20
-
21
-
22
-
23
-
24
-
25
-
26
-
27
-
28
-
29
-
30
-
31
-
32
-
33
-
34
-
35
-
36
-
37
-
38
-
39
-
40
-
41
-
42
-
43
-
44
-
45
-
46
-
47
-
48
-
49
-
50
-
51
-
52
-
53
-
54
-
55
-
56
-
57
-
58
-
59
-
60
-
61
-
62
-
63
-
64
-
65
-
66
-
67
-
68
-
69
-
70
-
71
-
72
-
73
-
74
-
75
-
76
-
77
-
78
-
79
-
80
-
81
-
82
-
83
-
84
-
85
-
86
-
87
-
88
-
89
-
90
-
91
-
92
-
93
-
94
-
95
-
96
-
97
-
98
-
99
-
100
-
101
-
102
-
103
-
104
-
105
-
106
-
107
-
108
-
109
-
110
-
111
-
112
-
113
-
114
-
115
-
116
-
117
-
118
-
119
-
120
-
121
-
122
-
123
-
124
-
125
-
126
-
127
-
128
-
129
-
130
-
131
-
132
-
133
-
134
-
135
-
136
-
137
-
138
-
139
-
140
-
141
-
142
-
143
-
144
-
145
-
146
-
147
-
148
-
149
-
150
-
151
-
 152
152 -
 153
153 -
 154
154 -
 155
155 -
 156
156 -
 157
157 -
 158
158 -
 159
159 -
 160
160 -
 161
161 -
 162
162 -
163
-
164
-
165
-
166
-
167
-
168
-
169
-
170
-
171
-
172
-
173
-
174
-
175
-
176
-
177
-
178
-
179
-
180
-
181
-
182
-
183
-
184
-
185
-
186
-
187
-
188
-
189
-
190
-
191
-
192
-
193
-
194
-
195
-
196
-
197
-
198
-
199
-
200
-
201
-
202
-
203
-
204
-
205
-
206
 |
 |
