Casio CFX-9800G-w Owners Manual - Page 98
Graph Ranse
 |
UPC - 079767128685
View all Casio CFX-9800G-w manuals
Add to My Manuals
Save this manual to your list of manuals |
Page 98 highlights
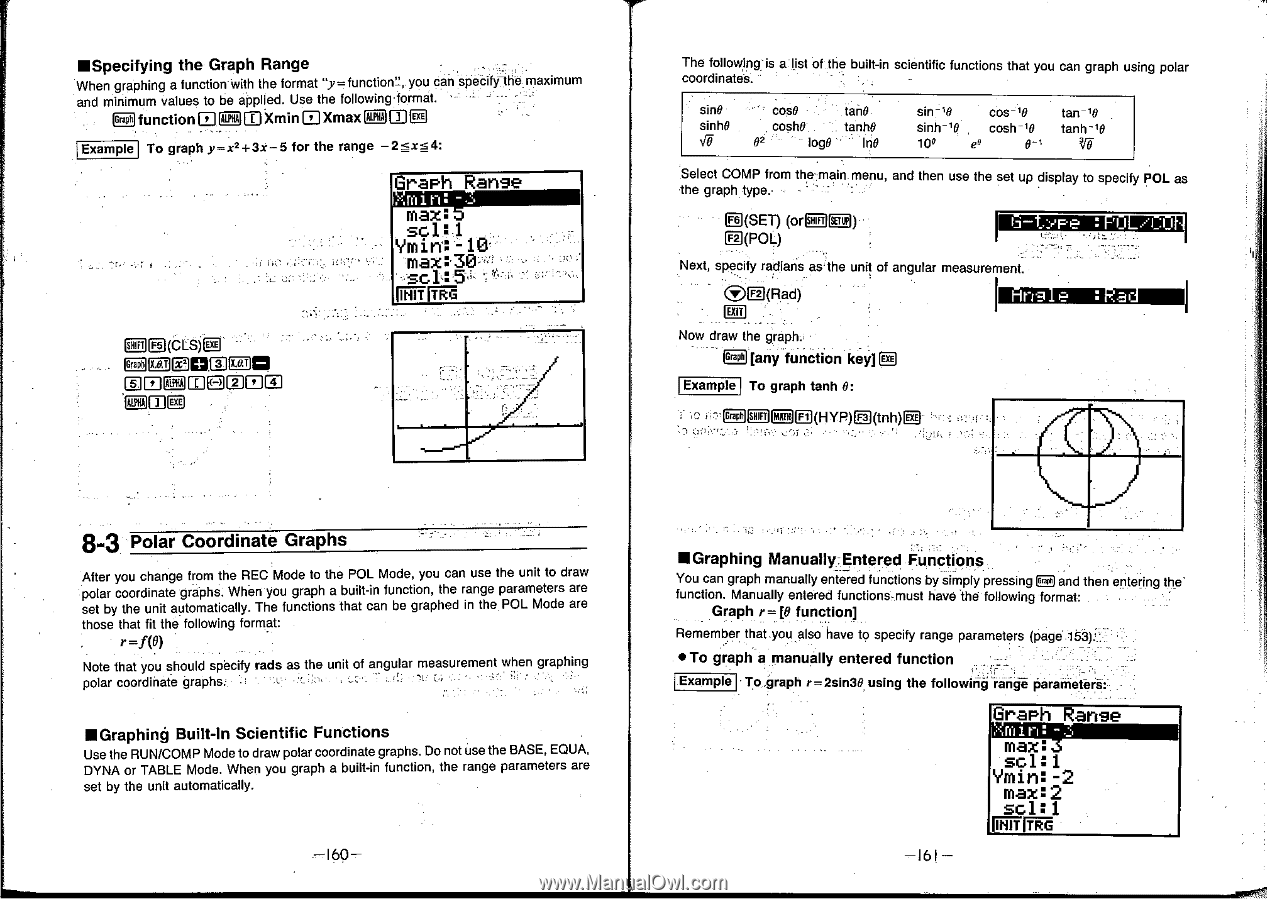
•Specifying the Graph Range When graphing a functionwith the format "y= function!, you can specify-the maximum and minimum values to be applied. Use the following format ! - 33 functionEF10 XminEXmaxiEilDEI Example To graph y=x2 +3x - 5 for the range - 2 ≤x≤ 4: Graph Ranse fill - max: sc1:1 Ym in: max - 10 30- so1:5 SID Fs cLs)E DIEIOnel IADiEmIEDMECIELD The following is a list of the built-in scientific functions that you can graph using polar coordinates. sine sinh0 cos0 tan0 cosh0 tanh0 02 log0 In0 cos -10 sinh-10 cosh -10 100 e° tan-10 tanh - I0 Select COMP from the main menu, and then use the set up display to specify POL as he graph type R(SET) (or 1=0 El(POL) Imiagenimonsam I Next, specify radians as- the unit of angular measurement. (DID(Rad) Now draw the graph [any function key] [E Example To graph tanh 0: I=E(HYP)E(tnh)g 8-3 Polar Coordinate Graphs After you change from the REC Mode to the POL Mode, you can use the unit to draw polar coordinate graphs. When you graph a built-in function, the range parameters are set by the unit automatically. The functions that can be graphed in the. POL Mode are those that fit the following format: r =f(0• ) Note that you should specify polar coordinate graphs. • rads L. as the unit of angular • measurement when -• graphing IN Graphing Built-In Scientific Functions Use the RUN/COMP Mode to draw polar coordinate graphs. Do not use the BASE, EWA, DYNA or TABLE Mode. When you graph a built-in function, the range parameters are set by the unit automatically. -160- •Graphing Manually Entered Functions You can graph manually entered functions by simply p essing ElE3 and then entering the' function. Manually entered functions must have the following format: Graph r= re function] Remember that you also have to specify range parameters (page 153): • To graph a manually entered function Example To.nraph 0_-.2sin30 using the following range parameters: . . Graph Ranse (juin max: so1:1 Ymin: - 2 max:2 sc1:1 W' M -161-
-
 1
1 -
2
-
3
-
4
-
5
-
6
-
7
-
8
-
9
-
10
-
11
-
12
-
13
-
14
-
15
-
16
-
17
-
18
-
19
-
20
-
21
-
22
-
23
-
24
-
25
-
26
-
27
-
28
-
29
-
30
-
31
-
32
-
33
-
34
-
35
-
36
-
37
-
38
-
39
-
40
-
41
-
42
-
43
-
44
-
45
-
46
-
47
-
48
-
49
-
50
-
51
-
52
-
53
-
54
-
55
-
56
-
57
-
58
-
59
-
60
-
61
-
62
-
63
-
64
-
65
-
66
-
67
-
68
-
69
-
70
-
71
-
72
-
73
-
74
-
75
-
76
-
77
-
78
-
79
-
80
-
81
-
82
-
83
-
84
-
85
-
86
-
87
-
88
-
89
-
90
-
91
-
92
-
 93
93 -
 94
94 -
 95
95 -
 96
96 -
 97
97 -
 98
98 -
 99
99 -
 100
100 -
 101
101 -
 102
102 -
 103
103 -
104
-
105
-
106
-
107
-
108
-
109
-
110
-
111
-
112
-
113
-
114
-
115
-
116
-
117
-
118
-
119
-
120
-
121
-
122
-
123
-
124
-
125
-
126
-
127
-
128
-
129
-
130
-
131
-
132
-
133
-
134
-
135
-
136
-
137
-
138
-
139
-
140
-
141
-
142
-
143
-
144
-
145
-
146
-
147
-
148
-
149
-
150
-
151
-
152
-
153
-
154
-
155
-
156
-
157
-
158
-
159
-
160
-
161
-
162
-
163
-
164
-
165
-
166
-
167
-
168
-
169
-
170
-
171
-
172
-
173
-
174
-
175
-
176
-
177
-
178
-
179
-
180
-
181
-
182
-
183
-
184
-
185
-
186
-
187
-
188
-
189
-
190
-
191
-
192
-
193
-
194
-
195
-
196
-
197
-
198
-
199
-
200
-
201
-
202
-
203
-
204
-
205
-
206
 |
 |