Casio CFX-9800G-w Owners Manual - Page 127
ERcLsci, ciuniommmmEi, Eincimmic
 |
UPC - 079767128685
View all Casio CFX-9800G-w manuals
Add to My Manuals
Save this manual to your list of manuals |
Page 127 highlights
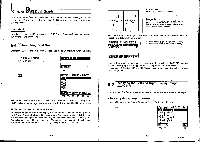
Example 2 To use Auto Range to graph the following functions when the x-axis range is set as X min = -4 and X max ..= 6: y (x + 2)(x - 4) y = -(x + 2) (x - 4) y= 2x + 4 y = -2x - 4 Input the function to draw the graph. Fs (SET) Mit ERcLsci E129 MEDI CIMM OCOEE El 211:3 BEIEGICIMEI ciuniommmmEi 123Eincimmic EJ El O® Graph Y=0‹+2)044)# Graph Y=-04+2)(X -43# Graph Y=2X+4# Graph Y=-04-4_ O(Zoom) CD (AUT) nifircYffigrga aill FS Notes *In the COMP, SD, REG, and MAT Modes, Auto Range is valid only for the last six graphs drawn. In the GRAPH Mode, Auto Range is valid for all graphs drawn. •You cannot use Auto Range inside a program. •When Ant() Range is used inside of a multistatement formed using colons only, Auto Range parameters are applied throughout the multistatement, even in sections that do not contain graph functions. .When Auto Range is used in a statement that uses a display result command to draw a graph, Auto Range parameters are applied up to the display result command, but any graphs drawn after the display result command are drawn according to normal graph overdraw rules (page 159). -218- •Graph Adjust This function makes the x-range the same as the y-range. It is helpful when drawing circle graphs. This function is available from the second Zoom/Auto Range menu. O(Zoom)El(Q) IlWaITURPria Example To use -Graph Adjust to draw the graph for r = 5 sin O. The range parameters should be set as shown here: Graph Range 1 n: -- max:: sc1:1 Ymin:-1 max:5 sc1:1 FrrIWG Draw the graph. 0(SET)E1(POL mmg(cLqg ERZoom)E1(Q) Adjust the graph. Fz (SQR) •The graph becomes a circle. tfalITE; iFrm WWI iCrD -219-
-
 1
1 -
2
-
3
-
4
-
5
-
6
-
7
-
8
-
9
-
10
-
11
-
12
-
13
-
14
-
15
-
16
-
17
-
18
-
19
-
20
-
21
-
22
-
23
-
24
-
25
-
26
-
27
-
28
-
29
-
30
-
31
-
32
-
33
-
34
-
35
-
36
-
37
-
38
-
39
-
40
-
41
-
42
-
43
-
44
-
45
-
46
-
47
-
48
-
49
-
50
-
51
-
52
-
53
-
54
-
55
-
56
-
57
-
58
-
59
-
60
-
61
-
62
-
63
-
64
-
65
-
66
-
67
-
68
-
69
-
70
-
71
-
72
-
73
-
74
-
75
-
76
-
77
-
78
-
79
-
80
-
81
-
82
-
83
-
84
-
85
-
86
-
87
-
88
-
89
-
90
-
91
-
92
-
93
-
94
-
95
-
96
-
97
-
98
-
99
-
100
-
101
-
102
-
103
-
104
-
105
-
106
-
107
-
108
-
109
-
110
-
111
-
112
-
113
-
114
-
115
-
116
-
117
-
118
-
119
-
120
-
121
-
 122
122 -
 123
123 -
 124
124 -
 125
125 -
 126
126 -
 127
127 -
 128
128 -
 129
129 -
 130
130 -
 131
131 -
 132
132 -
133
-
134
-
135
-
136
-
137
-
138
-
139
-
140
-
141
-
142
-
143
-
144
-
145
-
146
-
147
-
148
-
149
-
150
-
151
-
152
-
153
-
154
-
155
-
156
-
157
-
158
-
159
-
160
-
161
-
162
-
163
-
164
-
165
-
166
-
167
-
168
-
169
-
170
-
171
-
172
-
173
-
174
-
175
-
176
-
177
-
178
-
179
-
180
-
181
-
182
-
183
-
184
-
185
-
186
-
187
-
188
-
189
-
190
-
191
-
192
-
193
-
194
-
195
-
196
-
197
-
198
-
199
-
200
-
201
-
202
-
203
-
204
-
205
-
206
 |
 |
