Casio CFX-9800G-w Owners Manual - Page 122
comnam, mmnommmmEnfin, comic
 |
UPC - 079767128685
View all Casio CFX-9800G-w manuals
Add to My Manuals
Save this manual to your list of manuals |
Page 122 highlights
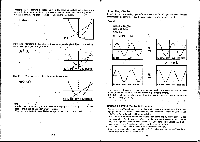
Fe (SET) ji(CLS) e%EI comnam mmnommmmEnfin comic CliniCIMEI (AI® 0 •You cannot scroll bar graphs and line graphs produced using single-variable statistical . data. -208 - • Zoom Functions You can use Zoom to enlarge or reduce graphs on the display. • Before Using Zoom Immediately after drawing a graph, press g(Zoom) to display the first Zoom/Auto Range menu. • E (Zoom) - • E.E E E The following are the operations that can be selected f om the function menu at the bot- tom of the display. Press the function key below the operation you want to specify. E(BOX) Graph enlargement using the Box Zoom function , 1:1(FCT) Ei(xf) Fa (x'4) Fs (AUT) Specification of x- and y-axis zoom factors Enlargement according to preset zoom factors Reduction according to preset zoom factors Automatic setting of y-axis range values for drawing of graph EP) to use full y-axis (page 217) Display of the second Zoom/Auto Range menu Pressing E(Q) causes the following menu to appear on the display. E(Q) I ric GrsriAWD E 2E Press the function key below the operation you want to specify. • E(ORG) Returns an enlarged or reduced graph to its original size LI(SQR) Adjusts ranges to make x-range the same as they-range (page Fa (RND) 219) Rounds coordinate values at the current pointer location to the optimum number of significant digits (page 220) MBox Zoom Function _ The Box Zoom Function Jets you cut out a specific section of a graph for zooming. •To zoom in on a part of a graph Example To specify a box on the graph for y - (x + 5)(x + 4)(x+ 3): Specify the range parameters. Graph Range -209- max: sc1:2 Ymi n: -4 max:2 sc1: 1 IHIT rna
-
 1
1 -
2
-
3
-
4
-
5
-
6
-
7
-
8
-
9
-
10
-
11
-
12
-
13
-
14
-
15
-
16
-
17
-
18
-
19
-
20
-
21
-
22
-
23
-
24
-
25
-
26
-
27
-
28
-
29
-
30
-
31
-
32
-
33
-
34
-
35
-
36
-
37
-
38
-
39
-
40
-
41
-
42
-
43
-
44
-
45
-
46
-
47
-
48
-
49
-
50
-
51
-
52
-
53
-
54
-
55
-
56
-
57
-
58
-
59
-
60
-
61
-
62
-
63
-
64
-
65
-
66
-
67
-
68
-
69
-
70
-
71
-
72
-
73
-
74
-
75
-
76
-
77
-
78
-
79
-
80
-
81
-
82
-
83
-
84
-
85
-
86
-
87
-
88
-
89
-
90
-
91
-
92
-
93
-
94
-
95
-
96
-
97
-
98
-
99
-
100
-
101
-
102
-
103
-
104
-
105
-
106
-
107
-
108
-
109
-
110
-
111
-
112
-
113
-
114
-
115
-
116
-
 117
117 -
 118
118 -
 119
119 -
 120
120 -
 121
121 -
 122
122 -
 123
123 -
 124
124 -
 125
125 -
 126
126 -
 127
127 -
128
-
129
-
130
-
131
-
132
-
133
-
134
-
135
-
136
-
137
-
138
-
139
-
140
-
141
-
142
-
143
-
144
-
145
-
146
-
147
-
148
-
149
-
150
-
151
-
152
-
153
-
154
-
155
-
156
-
157
-
158
-
159
-
160
-
161
-
162
-
163
-
164
-
165
-
166
-
167
-
168
-
169
-
170
-
171
-
172
-
173
-
174
-
175
-
176
-
177
-
178
-
179
-
180
-
181
-
182
-
183
-
184
-
185
-
186
-
187
-
188
-
189
-
190
-
191
-
192
-
193
-
194
-
195
-
196
-
197
-
198
-
199
-
200
-
201
-
202
-
203
-
204
-
205
-
206
 |
 |
