Casio CFX-9800G-w Owners Manual - Page 118
MPlot, Function, ERasfla, 1RTC001:3, Coord, MIMED
 |
UPC - 079767128685
View all Casio CFX-9800G-w manuals
Add to My Manuals
Save this manual to your list of manuals |
Page 118 highlights
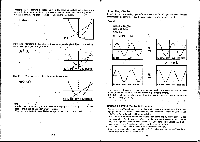
•lf a display statement ( I ) caused the first graph to be drawn (indicated when the message "- Disp -" is shown on the display), drawing the subsequent graph after activating the trace function, causes the previous coordinates ("x •-• '; and "y = ") to be cleared from the display. MPlot Function The Plot Function makes it possible to plot points anywhere on a graph. Note that there are two different plot operations: one for graphs in the COMP, SD, REG, or MAT Mode, and another for graphs in the GRAPH or TABLE Mode.. •To plot points in the COMP, SD, REG or MAT Mode Example To plot a point at x=2, y-2, with the following range parameters: ERasfla MID [1(RT)C001:3 Graph Range max: scl: 1 YmIn:-10 max:10 sc1:2 IMIT FliFS Pointer X/Y Caordinptes X=2.r12I2ISS, Y=I.93S4B3B Move the pointer using ®, 0, 0 and ®. Holding down these keys moves the pointer at high speed. N=2.55319111 Y=1.93511232 -200- Fe (Coord) O(Coord) X=2.553191489 Y=1.93548387 When-the pointer is at the location you want, press g to plot a point. At this lime, the pointer returns to the original point you specified (2, 2 in this example). + • X=2.02I2165 Y=1.9354632 You can changethe original point at any time by pressing ID(Plot) and inputtingnew coordinates. EI(Plot)1DEIIECI MIMED X=3.5'06392 Y=6.4516[29 -201-
-
 1
1 -
2
-
3
-
4
-
5
-
6
-
7
-
8
-
9
-
10
-
11
-
12
-
13
-
14
-
15
-
16
-
17
-
18
-
19
-
20
-
21
-
22
-
23
-
24
-
25
-
26
-
27
-
28
-
29
-
30
-
31
-
32
-
33
-
34
-
35
-
36
-
37
-
38
-
39
-
40
-
41
-
42
-
43
-
44
-
45
-
46
-
47
-
48
-
49
-
50
-
51
-
52
-
53
-
54
-
55
-
56
-
57
-
58
-
59
-
60
-
61
-
62
-
63
-
64
-
65
-
66
-
67
-
68
-
69
-
70
-
71
-
72
-
73
-
74
-
75
-
76
-
77
-
78
-
79
-
80
-
81
-
82
-
83
-
84
-
85
-
86
-
87
-
88
-
89
-
90
-
91
-
92
-
93
-
94
-
95
-
96
-
97
-
98
-
99
-
100
-
101
-
102
-
103
-
104
-
105
-
106
-
107
-
108
-
109
-
110
-
111
-
112
-
 113
113 -
 114
114 -
 115
115 -
 116
116 -
 117
117 -
 118
118 -
 119
119 -
 120
120 -
 121
121 -
 122
122 -
 123
123 -
124
-
125
-
126
-
127
-
128
-
129
-
130
-
131
-
132
-
133
-
134
-
135
-
136
-
137
-
138
-
139
-
140
-
141
-
142
-
143
-
144
-
145
-
146
-
147
-
148
-
149
-
150
-
151
-
152
-
153
-
154
-
155
-
156
-
157
-
158
-
159
-
160
-
161
-
162
-
163
-
164
-
165
-
166
-
167
-
168
-
169
-
170
-
171
-
172
-
173
-
174
-
175
-
176
-
177
-
178
-
179
-
180
-
181
-
182
-
183
-
184
-
185
-
186
-
187
-
188
-
189
-
190
-
191
-
192
-
193
-
194
-
195
-
196
-
197
-
198
-
199
-
200
-
201
-
202
-
203
-
204
-
205
-
206
 |
 |
