Casio CFX-9800G-w Owners Manual - Page 9
Quick, Start
 |
UPC - 079767128685
View all Casio CFX-9800G-w manuals
Add to My Manuals
Save this manual to your list of manuals |
Page 9 highlights
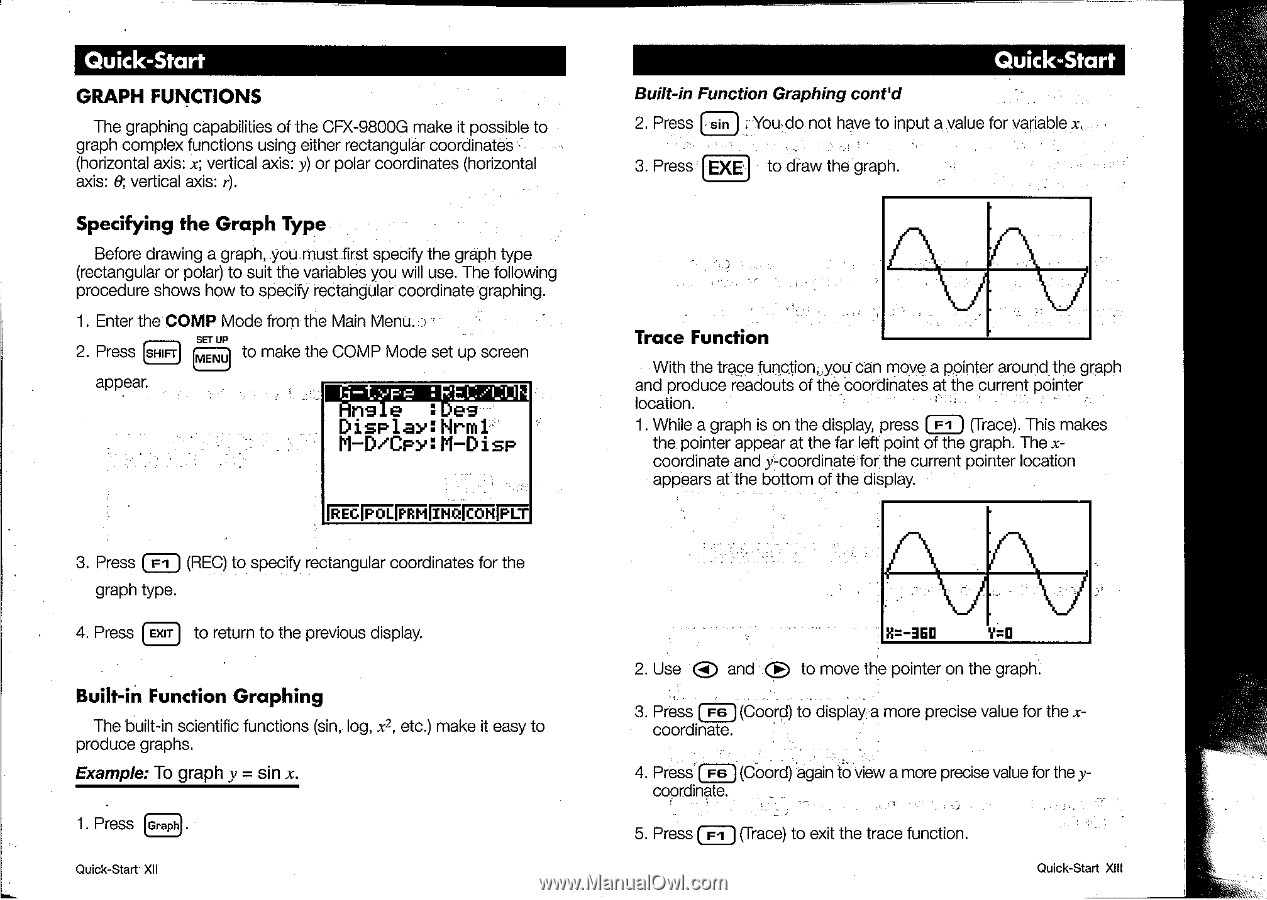
Quick-Start GRAPH FUNCTIONS The graphing capabilities of the CFX-9800G make it possible to graph complex functions using either rectangular coordinates (horizontal axis: x; vertical axis: y) or polar coordinates (horizontal axis: 0; vertical axis: r). Specifying the Graph Type Before drawing a graph, you must first specify the graph type (rectangular or polar) to suit the variables you will use. The following procedure shows how to specify rectangular coordinate graphing. 1. Enter the COMP Mode from the Main Menu. ) SET UP 2. Press SHIFT MENU to make the COMP Mode set up screen appear. MIREFIIMer la Display:Nrm1 M-D/CpY01-Disc INNME T 3. Press (if-I ) (REC) to specify rectangular coordinates for the graph type. 4. Press (EXIT) to return to the previous display. Built-in Function Graphing The built-in scientific functions (sin, log, x2, etc.) make it easy to produce graphs. Example: To graph y = sin x. 1. Press (Graph) Quick-Start XII Quick-Start Built-in Function Graphing cont'd 2. Press sin J . Youdo not have to input a value for variable x. 3. Press EXE to draw the graph. Trace Function With the trace functionuyou can move a pointer around the graph and produce readouts of the coordinates at the current pointer location. 1. While a graph is on the display, press ( Fl ) (Trace). This makes the pointer appear at the far left point of the graph. The xcoordinate and y-coordinate for the current pointer location appears at the bottom of the display. 2. Use 0 and 0 yr.o to move the pointer on the graph. 3. Press r F6 (Coord) to display-a more precise value for the xcoordinate. , 4. Press F6 (Coord) again to view a more precise value for the y- coordinate 5. Press (Fl J (Trace) to exit the trace function. Quick-Start XIII
-
 1
1 -
2
-
3
-
 4
4 -
 5
5 -
 6
6 -
 7
7 -
 8
8 -
 9
9 -
 10
10 -
 11
11 -
 12
12 -
 13
13 -
 14
14 -
15
-
16
-
17
-
18
-
19
-
20
-
21
-
22
-
23
-
24
-
25
-
26
-
27
-
28
-
29
-
30
-
31
-
32
-
33
-
34
-
35
-
36
-
37
-
38
-
39
-
40
-
41
-
42
-
43
-
44
-
45
-
46
-
47
-
48
-
49
-
50
-
51
-
52
-
53
-
54
-
55
-
56
-
57
-
58
-
59
-
60
-
61
-
62
-
63
-
64
-
65
-
66
-
67
-
68
-
69
-
70
-
71
-
72
-
73
-
74
-
75
-
76
-
77
-
78
-
79
-
80
-
81
-
82
-
83
-
84
-
85
-
86
-
87
-
88
-
89
-
90
-
91
-
92
-
93
-
94
-
95
-
96
-
97
-
98
-
99
-
100
-
101
-
102
-
103
-
104
-
105
-
106
-
107
-
108
-
109
-
110
-
111
-
112
-
113
-
114
-
115
-
116
-
117
-
118
-
119
-
120
-
121
-
122
-
123
-
124
-
125
-
126
-
127
-
128
-
129
-
130
-
131
-
132
-
133
-
134
-
135
-
136
-
137
-
138
-
139
-
140
-
141
-
142
-
143
-
144
-
145
-
146
-
147
-
148
-
149
-
150
-
151
-
152
-
153
-
154
-
155
-
156
-
157
-
158
-
159
-
160
-
161
-
162
-
163
-
164
-
165
-
166
-
167
-
168
-
169
-
170
-
171
-
172
-
173
-
174
-
175
-
176
-
177
-
178
-
179
-
180
-
181
-
182
-
183
-
184
-
185
-
186
-
187
-
188
-
189
-
190
-
191
-
192
-
193
-
194
-
195
-
196
-
197
-
198
-
199
-
200
-
201
-
202
-
203
-
204
-
205
-
206
 |
 |