Casio CFX-9800G-w Owners Manual - Page 140
Drawing, Dynamic, Graph, Range, sc1:1, Ymin:-2, max:4, DYNAMIC, GRAPH, Y=AX+B, Wiffinagal, Y=A4+Be+C
 |
UPC - 079767128685
View all Casio CFX-9800G-w manuals
Add to My Manuals
Save this manual to your list of manuals |
Page 140 highlights
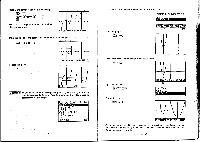
10-5 Drawing a Dynamic Graph The following is the general procedure you should use to draw a Dynamic Graph. 1. Select or input a function. 2. Define the dynamic coefficient. •This is a coefficient whose value changes in order to produce the different graphs. •If the dynamic coefficient is already defined from a previous operation, you can skip this step. 3. Assign values to each of the' coefficients of the function. 4. Specify the range of the dynamic coefficient. *If the range of the dynamic coefficient is already defined from a previous operation, you can skip this step. 5. Specify the speed of the draw operation. •If the speed is already defined from a previous operation, you can skip this step. 6. Draw the Dynamic Graph. • To set up for a Dynamic. Graph Each of these steps is covered in detail below, using the following example. Example To set up the Dynamic Graph for Y = A (X - 1)2 - 1, as coefficient A changes from 2 to 5 in increments of 1. Use the range parameter shown here for the graph: Graph Range lim2a; 1'al. sc1:1 Ymin:-2 max:4 sc1:1 IMAM Select the function whose graph you want to draw 0 (DYNAMIC GRAPH Y=AX+B Wiffinagal Display the menu for input of coefficient values. Fe (VAR) or Ei Function being graphed Current dynamic coefficient Function coefficients Y=A(4+B)e+C DYNAMIC VAR:A/ C=G -244- iSTMEDVBP E E E RUT UVH E E The following describes the operations available in the function menu at the bottom of the display. F+ (SET) E(RNG) Fa (SPb) IFs (AUT) Fa (DYN) Defines dynamic coefficient Dynamic coefficient range setting display Drawing speed setting display - Automatic specification of end and pitch values to match coeffi- cients, and start drawing Start drawing •Coefficient-Ais automatically selected as the dynamic coefficient. If you want to make another coefficient the dynamic coefficient, move the highlighting to that coefficient and press E(SET). •The values stored in memory tor each of the coefficients appears on the display. If a variable is assigned a complex number, only the integer part appears on the display. •If you press Fs (AUT) while the value assigned to the dynamic coefficient is zero, its value is automatically changed to 1= before drawing of the Dynamic Graph starts. Assign values" to each of the coefficients. HMEI HMEI Y=A(X+B)2+C DYNAMIC VAR:A/ tr A=2 B=-1 TEIERFIR70 VOW.' •Use C) and CD to move the highlighting to the coefficient whose value you want to input and input the value. •When you input a value for a coefficient, the value is stored in the corresponding value memory. Display the coefficient range setting menu. El(RNG) Dynamic coefficient Start value End value Pitch Y=A(X+B)2+C. DYNAMIC.Range ptch 1' - -245-
-
 1
1 -
2
-
3
-
4
-
5
-
6
-
7
-
8
-
9
-
10
-
11
-
12
-
13
-
14
-
15
-
16
-
17
-
18
-
19
-
20
-
21
-
22
-
23
-
24
-
25
-
26
-
27
-
28
-
29
-
30
-
31
-
32
-
33
-
34
-
35
-
36
-
37
-
38
-
39
-
40
-
41
-
42
-
43
-
44
-
45
-
46
-
47
-
48
-
49
-
50
-
51
-
52
-
53
-
54
-
55
-
56
-
57
-
58
-
59
-
60
-
61
-
62
-
63
-
64
-
65
-
66
-
67
-
68
-
69
-
70
-
71
-
72
-
73
-
74
-
75
-
76
-
77
-
78
-
79
-
80
-
81
-
82
-
83
-
84
-
85
-
86
-
87
-
88
-
89
-
90
-
91
-
92
-
93
-
94
-
95
-
96
-
97
-
98
-
99
-
100
-
101
-
102
-
103
-
104
-
105
-
106
-
107
-
108
-
109
-
110
-
111
-
112
-
113
-
114
-
115
-
116
-
117
-
118
-
119
-
120
-
121
-
122
-
123
-
124
-
125
-
126
-
127
-
128
-
129
-
130
-
131
-
132
-
133
-
134
-
 135
135 -
 136
136 -
 137
137 -
 138
138 -
 139
139 -
 140
140 -
 141
141 -
 142
142 -
 143
143 -
 144
144 -
 145
145 -
146
-
147
-
148
-
149
-
150
-
151
-
152
-
153
-
154
-
155
-
156
-
157
-
158
-
159
-
160
-
161
-
162
-
163
-
164
-
165
-
166
-
167
-
168
-
169
-
170
-
171
-
172
-
173
-
174
-
175
-
176
-
177
-
178
-
179
-
180
-
181
-
182
-
183
-
184
-
185
-
186
-
187
-
188
-
189
-
190
-
191
-
192
-
193
-
194
-
195
-
196
-
197
-
198
-
199
-
200
-
201
-
202
-
203
-
204
-
205
-
206
 |
 |
