Casio CFX-9800G-w Owners Manual - Page 119
Graph, Range, sc1:1, Ymin:-5, max:5, Y=2.096
 |
UPC - 079767128685
View all Casio CFX-9800G-w manuals
Add to My Manuals
Save this manual to your list of manuals |
Page 119 highlights
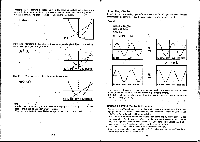
Notes •If you activate the Plot Function without specifying an x-coordinate and y-coordinate, the pointer appears in the center of the screen. •If you specify a point that is outside the range set up by the range parameters, the pointer does not appear on the display. •The x-coordinate value of the current pointer location is stored in the X value memory. The y-coordinate value is stored in the Y value memory. • To plot points in the GRAPH or TABLE Mode Example To plot a point on the graph represented by y = 2x2 - 3, with the following range parameters: Graph Range flan: max: sc1:1 Ymin:-5 max:5 sc1:1 WH FTIia First draw the graph for y = 2x2 -3 using the proced res described on page 181. c6 (TRW) Activate the Plot Funclion, and the pointer appears flashing in the center of the display Pointer Fa (Plot) X=0 Y=0 -202- Use the cursor keys to move the pointer around the display. El(Coord) X=1.06311291 Y=2.0961141 l (Coord) X=1.063829787 Y=2.096 4193 When,the pointer is at the location you want, press ID to plot a point. You can return the pointer to the center of the display at any time by pressing ®(Plot). E(Plot) X=0 Y=0 Notes '•You can switch the Plot Function off by pressing E(Cls). When you do, the graph is cleared from the display and then redrawn, without the points that you plotted. :•Whenever you are using the Plot Function, the location of the pointer is maintained in value memory. The x-coordinate is stored in value memory X, while the y-coordinate is stored in value memory Y. - 203-
-
 1
1 -
2
-
3
-
4
-
5
-
6
-
7
-
8
-
9
-
10
-
11
-
12
-
13
-
14
-
15
-
16
-
17
-
18
-
19
-
20
-
21
-
22
-
23
-
24
-
25
-
26
-
27
-
28
-
29
-
30
-
31
-
32
-
33
-
34
-
35
-
36
-
37
-
38
-
39
-
40
-
41
-
42
-
43
-
44
-
45
-
46
-
47
-
48
-
49
-
50
-
51
-
52
-
53
-
54
-
55
-
56
-
57
-
58
-
59
-
60
-
61
-
62
-
63
-
64
-
65
-
66
-
67
-
68
-
69
-
70
-
71
-
72
-
73
-
74
-
75
-
76
-
77
-
78
-
79
-
80
-
81
-
82
-
83
-
84
-
85
-
86
-
87
-
88
-
89
-
90
-
91
-
92
-
93
-
94
-
95
-
96
-
97
-
98
-
99
-
100
-
101
-
102
-
103
-
104
-
105
-
106
-
107
-
108
-
109
-
110
-
111
-
112
-
113
-
 114
114 -
 115
115 -
 116
116 -
 117
117 -
 118
118 -
 119
119 -
 120
120 -
 121
121 -
 122
122 -
 123
123 -
 124
124 -
125
-
126
-
127
-
128
-
129
-
130
-
131
-
132
-
133
-
134
-
135
-
136
-
137
-
138
-
139
-
140
-
141
-
142
-
143
-
144
-
145
-
146
-
147
-
148
-
149
-
150
-
151
-
152
-
153
-
154
-
155
-
156
-
157
-
158
-
159
-
160
-
161
-
162
-
163
-
164
-
165
-
166
-
167
-
168
-
169
-
170
-
171
-
172
-
173
-
174
-
175
-
176
-
177
-
178
-
179
-
180
-
181
-
182
-
183
-
184
-
185
-
186
-
187
-
188
-
189
-
190
-
191
-
192
-
193
-
194
-
195
-
196
-
197
-
198
-
199
-
200
-
201
-
202
-
203
-
204
-
205
-
206
 |
 |
