Casio CFX-9800G-w Owners Manual - Page 129
Amax:prommommil
 |
UPC - 079767128685
View all Casio CFX-9800G-w manuals
Add to My Manuals
Save this manual to your list of manuals |
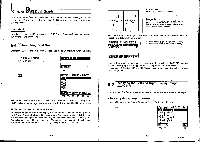
Page 129 highlights
• To overwrite graphs Example To draw graphs by substituting the values 3, 1, and -1 for A in the function y=Ax2-3. Use the following range parameters: Graph Ranse R MEMMEMMEM max: sc1:1 Ymin:- 10 max:1O sc1:2 F6 (SET) Mil E(CLS)EI 1=1 OCIM Dm=MEC(= WOUCICIIM 4 -222- 8-13 Some Graphing Examples The following examples are presented to show you some ways that the graphing functions can be used effectively. Note that all of these examples are performed in the COMP Mode. Example 1 To graph the function y =AA ± 4X3 36x2 - 160x+ 300 Use the following range parameters. Grmaapxh:pRraonmsmeommil sc1:2 Ymin: -600 max:600 sc1:20O rIwt rn-75 - Fs (SET) EnCLSCI GEOEITINICDn CID CI= nITICIMEILIfilLU Example 2 To graph the function y=x°+ 4x5 - 54x4 - 160.0+ 641x2 + 828x- 1260: Use the following range parameters. Graph Ranse CRSET)E(REC) WEI EIEM Fs (CLS)II 13119 012B =CC) acu ellThinCI w -223- sc1:2 Ymin: -8000 max:8OO0 sc1:2OOO MII5IWRG
-
 1
1 -
2
-
3
-
4
-
5
-
6
-
7
-
8
-
9
-
10
-
11
-
12
-
13
-
14
-
15
-
16
-
17
-
18
-
19
-
20
-
21
-
22
-
23
-
24
-
25
-
26
-
27
-
28
-
29
-
30
-
31
-
32
-
33
-
34
-
35
-
36
-
37
-
38
-
39
-
40
-
41
-
42
-
43
-
44
-
45
-
46
-
47
-
48
-
49
-
50
-
51
-
52
-
53
-
54
-
55
-
56
-
57
-
58
-
59
-
60
-
61
-
62
-
63
-
64
-
65
-
66
-
67
-
68
-
69
-
70
-
71
-
72
-
73
-
74
-
75
-
76
-
77
-
78
-
79
-
80
-
81
-
82
-
83
-
84
-
85
-
86
-
87
-
88
-
89
-
90
-
91
-
92
-
93
-
94
-
95
-
96
-
97
-
98
-
99
-
100
-
101
-
102
-
103
-
104
-
105
-
106
-
107
-
108
-
109
-
110
-
111
-
112
-
113
-
114
-
115
-
116
-
117
-
118
-
119
-
120
-
121
-
122
-
123
-
 124
124 -
 125
125 -
 126
126 -
 127
127 -
 128
128 -
 129
129 -
 130
130 -
 131
131 -
 132
132 -
 133
133 -
 134
134 -
135
-
136
-
137
-
138
-
139
-
140
-
141
-
142
-
143
-
144
-
145
-
146
-
147
-
148
-
149
-
150
-
151
-
152
-
153
-
154
-
155
-
156
-
157
-
158
-
159
-
160
-
161
-
162
-
163
-
164
-
165
-
166
-
167
-
168
-
169
-
170
-
171
-
172
-
173
-
174
-
175
-
176
-
177
-
178
-
179
-
180
-
181
-
182
-
183
-
184
-
185
-
186
-
187
-
188
-
189
-
190
-
191
-
192
-
193
-
194
-
195
-
196
-
197
-
198
-
199
-
200
-
201
-
202
-
203
-
204
-
205
-
206
 |
 |
