Casio CFX-9800G-w Owners Manual - Page 15
coordinates
 |
UPC - 079767128685
View all Casio CFX-9800G-w manuals
Add to My Manuals
Save this manual to your list of manuals |
Page 15 highlights
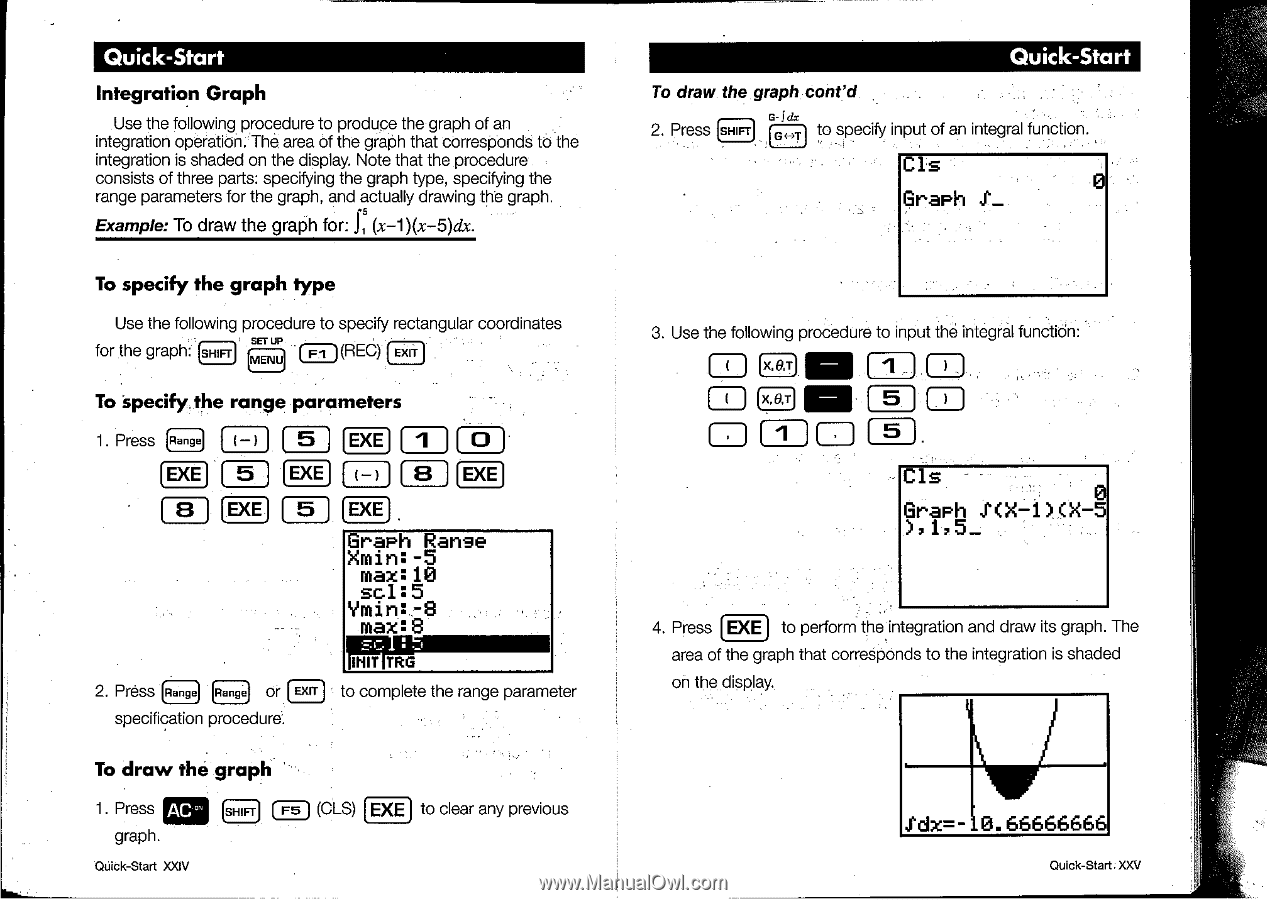
Quick-Start Integration Graph Use the following procedure to produce the graph of an integration operation. The area of the graph that corresponds to the integration is shaded on the display. Note that the procedure consists of three parts: specifying the graph type, specifying the range parameters for the graph, and actually drawing the graph. Example: To draw the graph for: J, (x-1)(x-5)dx. To specify the graph type Use the following procedure to specify rectangular coordinates for the graph: (SHIFT SET UP [MENU (-- )(REC) (Exil To specify, the range parameters 1. Press (Ragne) I-) ) 5 (EXE) I I (o) (5) (EXE) 8 (EXE 8 I 5 EXE) Graph Range Xmin:-5 max:10 sc1:5 Ymin:78 max:8 2. Press (Range) Range) or EXIT specification procedure. FairERTF IMIIIMM o complete the range parameter To draw the graph 1. Press AC° (SHIFT) graph Quick-Start XXIV (CLS) EXE) to clear any previous Quick-Start To draw the graph cont'd 0-1a.= 2. Press SHIFT) (G++T) to specify input of an integral function. Cis Graph 3. Use the following procedure to input the integral functidn: )(all O ( ( I ) ( ) i ( • ) (5) Cls 0 Graph P(X-1)(X-5 ),1,5_ 4. Press (EXE to perform the in egration and draw its graph. The area of the graph that corresponds to the integration is shaded on the display. $dx=- 0.66666666 Quick-Start. )00/
-
 1
1 -
2
-
3
-
4
-
5
-
6
-
7
-
8
-
9
-
 10
10 -
 11
11 -
 12
12 -
 13
13 -
 14
14 -
 15
15 -
 16
16 -
 17
17 -
 18
18 -
 19
19 -
 20
20 -
21
-
22
-
23
-
24
-
25
-
26
-
27
-
28
-
29
-
30
-
31
-
32
-
33
-
34
-
35
-
36
-
37
-
38
-
39
-
40
-
41
-
42
-
43
-
44
-
45
-
46
-
47
-
48
-
49
-
50
-
51
-
52
-
53
-
54
-
55
-
56
-
57
-
58
-
59
-
60
-
61
-
62
-
63
-
64
-
65
-
66
-
67
-
68
-
69
-
70
-
71
-
72
-
73
-
74
-
75
-
76
-
77
-
78
-
79
-
80
-
81
-
82
-
83
-
84
-
85
-
86
-
87
-
88
-
89
-
90
-
91
-
92
-
93
-
94
-
95
-
96
-
97
-
98
-
99
-
100
-
101
-
102
-
103
-
104
-
105
-
106
-
107
-
108
-
109
-
110
-
111
-
112
-
113
-
114
-
115
-
116
-
117
-
118
-
119
-
120
-
121
-
122
-
123
-
124
-
125
-
126
-
127
-
128
-
129
-
130
-
131
-
132
-
133
-
134
-
135
-
136
-
137
-
138
-
139
-
140
-
141
-
142
-
143
-
144
-
145
-
146
-
147
-
148
-
149
-
150
-
151
-
152
-
153
-
154
-
155
-
156
-
157
-
158
-
159
-
160
-
161
-
162
-
163
-
164
-
165
-
166
-
167
-
168
-
169
-
170
-
171
-
172
-
173
-
174
-
175
-
176
-
177
-
178
-
179
-
180
-
181
-
182
-
183
-
184
-
185
-
186
-
187
-
188
-
189
-
190
-
191
-
192
-
193
-
194
-
195
-
196
-
197
-
198
-
199
-
200
-
201
-
202
-
203
-
204
-
205
-
206
 |
 |