Casio CFX-9800G-w Owners Manual - Page 117
ETrace
 |
UPC - 079767128685
View all Casio CFX-9800G-w manuals
Add to My Manuals
Save this manual to your list of manuals |
Page 117 highlights
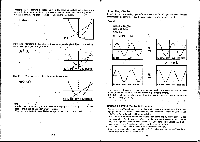
Press E(Trace) to activate the Trace Function. The coordinate values on the display are for x = Xmin of the graph drawn by the last function in the multistatement (y = 2x - 3 in this example). The pointer is also located on the last graph. E(Trace) Move the pointer along the line where it is located using C) and C.). Holding down either key moves the pointer at high speed 0-0 Kr-I:102121 Y=-6.404255 Use 0 and 0 to move the pointer between the two graphs. Kr-1.102129 Yr-1.400SM Note, •If you have more than two graphs shown on the display, the ® and C) cursors can be used td move the pointer from graph to graph. When you are finished, press vi (Trace) again to exit the Trace Function. -198- EScrolling Graphs If the graph you are tracing runs off the display to theleft or right, the display scrolls automatically to follow the Trace Function pointer as you trace the graph. Example 6111 LI(Deg)El aus)g 129 EEO 0(Trace)C) C) Hrahll Y=I1 lir369.G5959 Y=0.1332869 V\I lir-31&3829 Yr0.80501 lir-290.123Li Yr0.11169499 •You cannot scroll polar coordinate or parametric graphs. You also cannot scroll over drawn graphs that contain polar coordinate or parametric graphs. •If Dual-G is switched'on when. you activate the trace function, you will not be able to scroll the display (page 24). ,Notes on Using the Trace Function .. . . •You can use the Trace Function immediately after you drawa,graph only. If you draw a graph and then perform a calculation or any other operation (besidesE-Disp, Range, or G-T), the Trace Function will be unavailable. •The values for the x- and y-coordinates at the bottom of the display use 10-digit or 5-digit mantissas with a 2-digit exponent. When both the x-axis and y-axis are displayed, an 8-digit or 4-digit mantissa and 2-digit exponent is used for positive values. A 7-digit or 3-digit mantissa.and 2-digit exponent is used for negative values. • *Yob cannot use' the TraceFunction during program execution. 'Once program execution is suspended by a ".4" symbol, you can use the Trace Func- tion on a graph produced at that point. -199-
-
 1
1 -
2
-
3
-
4
-
5
-
6
-
7
-
8
-
9
-
10
-
11
-
12
-
13
-
14
-
15
-
16
-
17
-
18
-
19
-
20
-
21
-
22
-
23
-
24
-
25
-
26
-
27
-
28
-
29
-
30
-
31
-
32
-
33
-
34
-
35
-
36
-
37
-
38
-
39
-
40
-
41
-
42
-
43
-
44
-
45
-
46
-
47
-
48
-
49
-
50
-
51
-
52
-
53
-
54
-
55
-
56
-
57
-
58
-
59
-
60
-
61
-
62
-
63
-
64
-
65
-
66
-
67
-
68
-
69
-
70
-
71
-
72
-
73
-
74
-
75
-
76
-
77
-
78
-
79
-
80
-
81
-
82
-
83
-
84
-
85
-
86
-
87
-
88
-
89
-
90
-
91
-
92
-
93
-
94
-
95
-
96
-
97
-
98
-
99
-
100
-
101
-
102
-
103
-
104
-
105
-
106
-
107
-
108
-
109
-
110
-
111
-
 112
112 -
 113
113 -
 114
114 -
 115
115 -
 116
116 -
 117
117 -
 118
118 -
 119
119 -
 120
120 -
 121
121 -
 122
122 -
123
-
124
-
125
-
126
-
127
-
128
-
129
-
130
-
131
-
132
-
133
-
134
-
135
-
136
-
137
-
138
-
139
-
140
-
141
-
142
-
143
-
144
-
145
-
146
-
147
-
148
-
149
-
150
-
151
-
152
-
153
-
154
-
155
-
156
-
157
-
158
-
159
-
160
-
161
-
162
-
163
-
164
-
165
-
166
-
167
-
168
-
169
-
170
-
171
-
172
-
173
-
174
-
175
-
176
-
177
-
178
-
179
-
180
-
181
-
182
-
183
-
184
-
185
-
186
-
187
-
188
-
189
-
190
-
191
-
192
-
193
-
194
-
195
-
196
-
197
-
198
-
199
-
200
-
201
-
202
-
203
-
204
-
205
-
206
 |
 |
