Casio CFX-9800G-w Owners Manual - Page 126
Cicim
 |
UPC - 079767128685
View all Casio CFX-9800G-w manuals
Add to My Manuals
Save this manual to your list of manuals |
Page 126 highlights
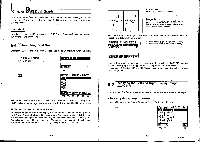
Input the zoom factors for the x-axis and y-axis. E(FCT) MCC) Factor Xfct:5 I tC Press ID( x f) to redra he graph according to the factors you have specified. Fa (xf) Note that these graphs are not tangent as they appear on the normal (unenlarged) display • To initialize the zoom factors E(Zoom)ERFCT)III(INIT) Anytime you perform the above operation, the unit initializes the zoom factors to the following settings. Factor • To specify the zoom factors within a program Use the following format to specify the zoom factors in a program. Factor (Xfact), (Yfact) Note •You can use only positive values as zoom factors. You can perform calculations that consist of up to 10 numbers, operators, etc. •For graphs drawn in the COMP, SD, REG, or MAT Mode, the Factor Zoom can be used to zoom only the most recently drawn six graphs. In the case of the GRAPH Mode, Factor Zoom can be used to zoom any graphs drawn. •You cannot enlarge or reduce a single-variable bar or line graph. IllAuto Range The Auto Range function automatically sets the range value of they-axis so that the graph completely fills the screen along the y-axis. This function is available from the first Zoom/Auto Range menu. D(Zoom) BOxNOTx Mxi.e4Wral Example 1 To use Auto Range to graph y = x2 - 5 when the x-axis range is set as X min = -3 and X max = 5: Input the function to draw the graph. El(SET)E(REC) g(a_s) ES LISMCicim 'Graph Y=X 2-5_ Press El(Zoom) to display the first Zoom/Auto Range menu. El(Zoom) FS Press Fs (AUT) to draw the graph. E(AUT) *Pressing MEI twice or soxliEIR E. P clears the menu from the bottom of the display. -216 - -217-
-
 1
1 -
2
-
3
-
4
-
5
-
6
-
7
-
8
-
9
-
10
-
11
-
12
-
13
-
14
-
15
-
16
-
17
-
18
-
19
-
20
-
21
-
22
-
23
-
24
-
25
-
26
-
27
-
28
-
29
-
30
-
31
-
32
-
33
-
34
-
35
-
36
-
37
-
38
-
39
-
40
-
41
-
42
-
43
-
44
-
45
-
46
-
47
-
48
-
49
-
50
-
51
-
52
-
53
-
54
-
55
-
56
-
57
-
58
-
59
-
60
-
61
-
62
-
63
-
64
-
65
-
66
-
67
-
68
-
69
-
70
-
71
-
72
-
73
-
74
-
75
-
76
-
77
-
78
-
79
-
80
-
81
-
82
-
83
-
84
-
85
-
86
-
87
-
88
-
89
-
90
-
91
-
92
-
93
-
94
-
95
-
96
-
97
-
98
-
99
-
100
-
101
-
102
-
103
-
104
-
105
-
106
-
107
-
108
-
109
-
110
-
111
-
112
-
113
-
114
-
115
-
116
-
117
-
118
-
119
-
120
-
 121
121 -
 122
122 -
 123
123 -
 124
124 -
 125
125 -
 126
126 -
 127
127 -
 128
128 -
 129
129 -
 130
130 -
 131
131 -
132
-
133
-
134
-
135
-
136
-
137
-
138
-
139
-
140
-
141
-
142
-
143
-
144
-
145
-
146
-
147
-
148
-
149
-
150
-
151
-
152
-
153
-
154
-
155
-
156
-
157
-
158
-
159
-
160
-
161
-
162
-
163
-
164
-
165
-
166
-
167
-
168
-
169
-
170
-
171
-
172
-
173
-
174
-
175
-
176
-
177
-
178
-
179
-
180
-
181
-
182
-
183
-
184
-
185
-
186
-
187
-
188
-
189
-
190
-
191
-
192
-
193
-
194
-
195
-
196
-
197
-
198
-
199
-
200
-
201
-
202
-
203
-
204
-
205
-
206
 |
 |
