Casio CFX-9800G-w Owners Manual - Page 153
max:rimmommomm
 |
UPC - 079767128685
View all Casio CFX-9800G-w manuals
Add to My Manuals
Save this manual to your list of manuals |
Page 153 highlights
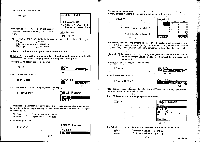
E(INS) X Y2 0 -2 2 la • To add a row Example To add a row below row 6 in the previous example (page 257): g(Row) 00000® Y2 25i 4 116 5 '13 IBS 6 1:1 -1ErSFFETY F3 (ADD) H Y2 LIS 13 105 105i • To delete a table • While the table you want to delete is shown on the display, press El(ERS). E(ERS) IFri? ERASE HUE ? Fi rot Press E(ms) to delete the table or g (NO) to abort the delete operation without delet- ing anything. -270- IMIDrawing a Graph Using Table Data There are two types of graph you can draw using table data. A connected-point graph can be drawn using the function stored in memory. A plotted-point graph-can be drawn plotting only the points of the values in the table, without connecting them. •Note that graphs using table data are always drawn using rectangular coordinates. EBefore Drawing a Graph Be sure that you make the following two specifications before trying to draw graphs from memory. *Specify the color of the graph as blue, orange, or green. *Specify the functions whose graphs you want to draw. • To specify the color of a graph The default color for graph drawing blue, but you can use the following procedure to change the color to orange or green if you want. Select the area that contains the function of the graph whose color you want to change. Display the Graph Color Menu. Fa (COLR) ilI rtlmiriblIWI E(BLU) E(ORN) IL)(GRN) Blue Orange Green Press the function key that corresponds to the color you want to specify. ESpecifying the Graphs to be Drawn • You can specify drawing of the graphs for all functions stored in memory (overlaid on the display), or drawing of the graphs for specific functions. The procedure to specify graph drawing/non-drawing is identical to the procedure for specifying numeric table generation/non-generation. See page 262 for details. • To draw the graphs of a specific function Example To select the function y = 3x2 - 2 in area Y2 and draw it as a connected type graph. Use the following range parameters: Grmaapxh:rRiamnmgoemmomm -271- sc1:1 Ymin:-2 max:106 wsircd1r:o2
-
 1
1 -
2
-
3
-
4
-
5
-
6
-
7
-
8
-
9
-
10
-
11
-
12
-
13
-
14
-
15
-
16
-
17
-
18
-
19
-
20
-
21
-
22
-
23
-
24
-
25
-
26
-
27
-
28
-
29
-
30
-
31
-
32
-
33
-
34
-
35
-
36
-
37
-
38
-
39
-
40
-
41
-
42
-
43
-
44
-
45
-
46
-
47
-
48
-
49
-
50
-
51
-
52
-
53
-
54
-
55
-
56
-
57
-
58
-
59
-
60
-
61
-
62
-
63
-
64
-
65
-
66
-
67
-
68
-
69
-
70
-
71
-
72
-
73
-
74
-
75
-
76
-
77
-
78
-
79
-
80
-
81
-
82
-
83
-
84
-
85
-
86
-
87
-
88
-
89
-
90
-
91
-
92
-
93
-
94
-
95
-
96
-
97
-
98
-
99
-
100
-
101
-
102
-
103
-
104
-
105
-
106
-
107
-
108
-
109
-
110
-
111
-
112
-
113
-
114
-
115
-
116
-
117
-
118
-
119
-
120
-
121
-
122
-
123
-
124
-
125
-
126
-
127
-
128
-
129
-
130
-
131
-
132
-
133
-
134
-
135
-
136
-
137
-
138
-
139
-
140
-
141
-
142
-
143
-
144
-
145
-
146
-
147
-
 148
148 -
 149
149 -
 150
150 -
 151
151 -
 152
152 -
 153
153 -
 154
154 -
 155
155 -
 156
156 -
 157
157 -
 158
158 -
159
-
160
-
161
-
162
-
163
-
164
-
165
-
166
-
167
-
168
-
169
-
170
-
171
-
172
-
173
-
174
-
175
-
176
-
177
-
178
-
179
-
180
-
181
-
182
-
183
-
184
-
185
-
186
-
187
-
188
-
189
-
190
-
191
-
192
-
193
-
194
-
195
-
196
-
197
-
198
-
199
-
200
-
201
-
202
-
203
-
204
-
205
-
206
 |
 |
