Casio CFX-9800G-w Owners Manual - Page 94
Graph, Range, sc1:2, Ymin:-10, max:10, sc1:5, Ptch:3.6, GraPh, max:5, INIT., Xmin:0, iffr7, Range.
 |
UPC - 079767128685
View all Casio CFX-9800G-w manuals
Add to My Manuals
Save this manual to your list of manuals |
Page 94 highlights
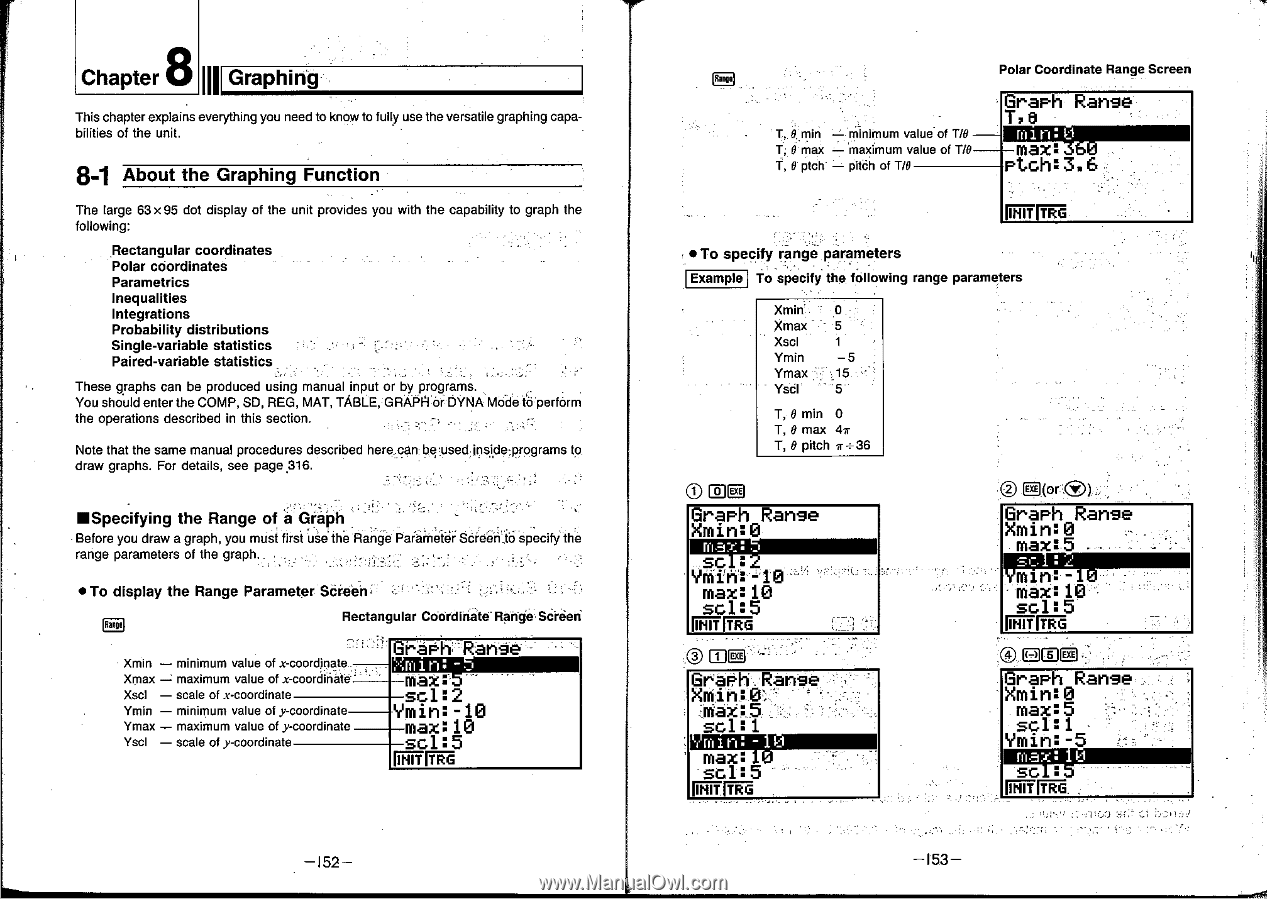
8 Chapter Graphing III This chapter explains everything you need to know to fully use the versatile graphing capabilities of the unit. 8-1 About the Graphing Function The large 63 x 95 dot display of the unit provides you with the capability to graph the following: Rectangular coordinates Polar coordinates Parametrics Inequalities Integrations Probability distributions Single-variable statistics Paired-variable statistics These graphs can be produced using manual input or by programs. You should enter the COMP, SD, REG, MAT, TABLE, GRAPH or DYNA Mode idperform the operations described in this section. Note that the same manual procedures described heracan bd:used insyle:programs to draw graphs. For details, see page 316. •Specifying the Range of a GraPh Before you draw a graph, you must first use the RangeParameter Screen.tO specify the range parameters of the graph. • To display the Range Parameter Screen, 5- , Rectangular Coordinate Rande Screen Xmin - minimum value of x-coordinate Xmax maximum value of x-coordinate" Xscl - scale of x-coordinate Ymin - minimum value of y-coordinate Ymax - maximum value of y-coordinate Yscl - scale of y-coordinate Graph Range max: sc1:2 Ymin:-10 max:10 sc1:5 -152- T,.B min - minimum value- of T/0 T; 9 max - maximum value of T/0 T, 0 ptch - pitch of T/9 Polar Coordinate Range Screen Graph Range T.9 max: Ptch:3.6 • To specify range parameters Example To specify the following range parameters Xmin Xmax Xscl Ymin Ymax Yscl 0 5 1 -5 15 - 5 T, 0 min 0 T, 0 max 47r T, 0 pitch x=36 max: Sc , Ymih:-10 - max:10 sc1:5 IRIT rTnItG ® EC GraPh Range Xmin: max:5 scl: 1 sc1:5 INIT. ® (DOI* CD) Graph Range Xmin:0 max:5 min:max: 10 scl:5 iffr7 TRG Graph Range. Xmin:0 max:5 scl:1 Ymin: -5 Max 1,1 SC • F! ill nTgi , -153-
-
 1
1 -
2
-
3
-
4
-
5
-
6
-
7
-
8
-
9
-
10
-
11
-
12
-
13
-
14
-
15
-
16
-
17
-
18
-
19
-
20
-
21
-
22
-
23
-
24
-
25
-
26
-
27
-
28
-
29
-
30
-
31
-
32
-
33
-
34
-
35
-
36
-
37
-
38
-
39
-
40
-
41
-
42
-
43
-
44
-
45
-
46
-
47
-
48
-
49
-
50
-
51
-
52
-
53
-
54
-
55
-
56
-
57
-
58
-
59
-
60
-
61
-
62
-
63
-
64
-
65
-
66
-
67
-
68
-
69
-
70
-
71
-
72
-
73
-
74
-
75
-
76
-
77
-
78
-
79
-
80
-
81
-
82
-
83
-
84
-
85
-
86
-
87
-
88
-
 89
89 -
 90
90 -
 91
91 -
 92
92 -
 93
93 -
 94
94 -
 95
95 -
 96
96 -
 97
97 -
 98
98 -
 99
99 -
100
-
101
-
102
-
103
-
104
-
105
-
106
-
107
-
108
-
109
-
110
-
111
-
112
-
113
-
114
-
115
-
116
-
117
-
118
-
119
-
120
-
121
-
122
-
123
-
124
-
125
-
126
-
127
-
128
-
129
-
130
-
131
-
132
-
133
-
134
-
135
-
136
-
137
-
138
-
139
-
140
-
141
-
142
-
143
-
144
-
145
-
146
-
147
-
148
-
149
-
150
-
151
-
152
-
153
-
154
-
155
-
156
-
157
-
158
-
159
-
160
-
161
-
162
-
163
-
164
-
165
-
166
-
167
-
168
-
169
-
170
-
171
-
172
-
173
-
174
-
175
-
176
-
177
-
178
-
179
-
180
-
181
-
182
-
183
-
184
-
185
-
186
-
187
-
188
-
189
-
190
-
191
-
192
-
193
-
194
-
195
-
196
-
197
-
198
-
199
-
200
-
201
-
202
-
203
-
204
-
205
-
206
 |
 |