Dell PowerConnect W Clearpass 100 Software 3.7 Deployment Guide - Page 248
About Custom Reports, Report Type, Report Parameters, Data Source, Source Filters, Groups
 |
View all Dell PowerConnect W Clearpass 100 Software manuals
Add to My Manuals
Save this manual to your list of manuals |
Page 248 highlights
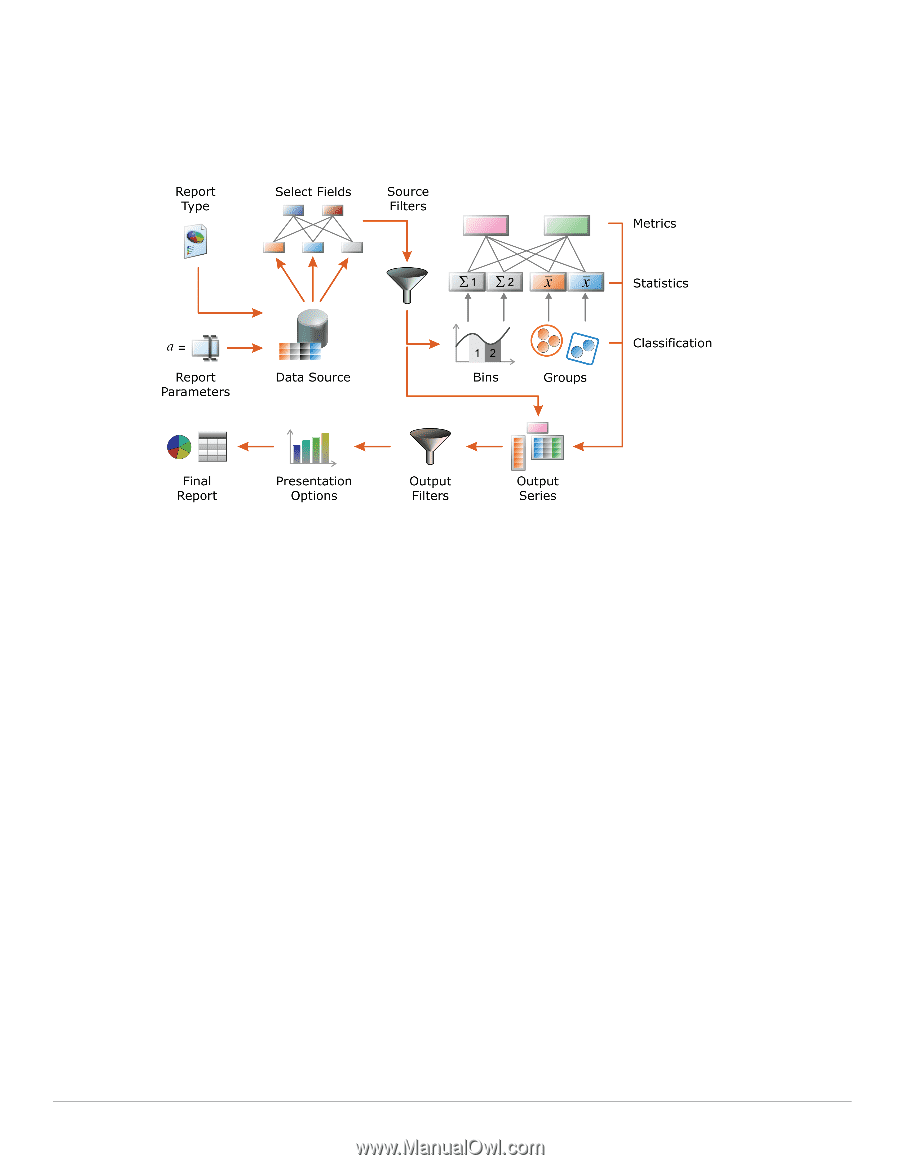
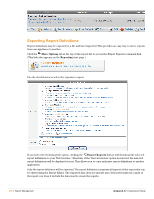
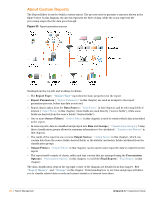
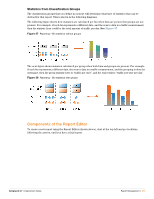
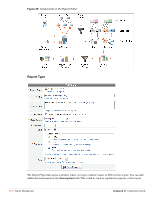
About Custom Reports The Report Editor is used to build a custom report. The process used to generate a report is shown in the figure below. In this diagram, the arrows represent the flow of data, while the icons represent the processing stages that the data goes through. Figure 33 Report generation process . Starting from the top left, and working clockwise: The Report Type ( "Report Type") specifies the basic properties for the report. Report Parameters ( "Report Parameters" in this chapter) are used as an input to the report generation process, before any data is selected. Report data is taken from the Data Source ( "Data Source" in this chapter), and by selecting fields of interest ( "Select Fields" in this chapter). Some fields are used directly ("source fields"), while some fields are derived from the source fields ("derived fields"). One or more Source Filters ( "Source Filters" in this chapter) is used to restrict which data is included in the report. In some reports, data is classified and grouped into Bins and Groups ( "Classification Groups"). Using these classification groups allows for summary information to be calculated ( "Statistics and Metrics" in this chapter). The result of the report is one or more Output Series ( "Output Series" in this chapter), which can contain data from the source fields, derived fields, or the statistic and metric fields calculated from the classification groups. Output Filters ( "Output Filters" in this chapter) can be used to select specific data to output from the report. The report itself consists of charts, tables and text content that are arranged using the Presentation Options ( "Presentation Options" in this chapter) to yield the Final Report ( "Final Report" in this chapter). The data classification steps in the top right corner of the diagram are detailed in in this chapter. See "Report History" and "Groups" in this chapter. Understanding how to use bins and groups will allow you to classify related data records and extract statistics of interest from them. 248 | Report Management Amigopod 3.7 | Deployment Guide
-
 1
1 -
2
-
3
-
4
-
5
-
6
-
7
-
8
-
9
-
10
-
11
-
12
-
13
-
14
-
15
-
16
-
17
-
18
-
19
-
20
-
21
-
22
-
23
-
24
-
25
-
26
-
27
-
28
-
29
-
30
-
31
-
32
-
33
-
34
-
35
-
36
-
37
-
38
-
39
-
40
-
41
-
42
-
43
-
44
-
45
-
46
-
47
-
48
-
49
-
50
-
51
-
52
-
53
-
54
-
55
-
56
-
57
-
58
-
59
-
60
-
61
-
62
-
63
-
64
-
65
-
66
-
67
-
68
-
69
-
70
-
71
-
72
-
73
-
74
-
75
-
76
-
77
-
78
-
79
-
80
-
81
-
82
-
83
-
84
-
85
-
86
-
87
-
88
-
89
-
90
-
91
-
92
-
93
-
94
-
95
-
96
-
97
-
98
-
99
-
100
-
101
-
102
-
103
-
104
-
105
-
106
-
107
-
108
-
109
-
110
-
111
-
112
-
113
-
114
-
115
-
116
-
117
-
118
-
119
-
120
-
121
-
122
-
123
-
124
-
125
-
126
-
127
-
128
-
129
-
130
-
131
-
132
-
133
-
134
-
135
-
136
-
137
-
138
-
139
-
140
-
141
-
142
-
143
-
144
-
145
-
146
-
147
-
148
-
149
-
150
-
151
-
152
-
153
-
154
-
155
-
156
-
157
-
158
-
159
-
160
-
161
-
162
-
163
-
164
-
165
-
166
-
167
-
168
-
169
-
170
-
171
-
172
-
173
-
174
-
175
-
176
-
177
-
178
-
179
-
180
-
181
-
182
-
183
-
184
-
185
-
186
-
187
-
188
-
189
-
190
-
191
-
192
-
193
-
194
-
195
-
196
-
197
-
198
-
199
-
200
-
201
-
202
-
203
-
204
-
205
-
206
-
207
-
208
-
209
-
210
-
211
-
212
-
213
-
214
-
215
-
216
-
217
-
218
-
219
-
220
-
221
-
222
-
223
-
224
-
225
-
226
-
227
-
228
-
229
-
230
-
231
-
232
-
233
-
234
-
235
-
236
-
237
-
238
-
239
-
240
-
241
-
242
-
 243
243 -
 244
244 -
 245
245 -
 246
246 -
 247
247 -
 248
248 -
 249
249 -
 250
250 -
 251
251 -
 252
252 -
 253
253 -
254
-
255
-
256
-
257
-
258
-
259
-
260
-
261
-
262
-
263
-
264
-
265
-
266
-
267
-
268
-
269
-
270
-
271
-
272
-
273
-
274
-
275
-
276
-
277
-
278
-
279
-
280
-
281
-
282
-
283
-
284
-
285
-
286
-
287
-
288
-
289
-
290
-
291
-
292
-
293
-
294
-
295
-
296
-
297
-
298
-
299
-
300
-
301
-
302
-
303
-
304
-
305
-
306
-
307
-
308
-
309
-
310
-
311
-
312
-
313
-
314
-
315
-
316
-
317
-
318
-
319
-
320
-
321
-
322
-
323
-
324
-
325
-
326
-
327
-
328
-
329
-
330
-
331
-
332
-
333
-
334
-
335
-
336
-
337
-
338
-
339
-
340
-
341
-
342
-
343
-
344
-
345
-
346
-
347
-
348
-
349
-
350
-
351
-
352
-
353
-
354
-
355
-
356
-
357
-
358
-
359
-
360
-
361
-
362
-
363
-
364
-
365
-
366
-
367
-
368
-
369
-
370
-
371
-
372
-
373
-
374
-
375
-
376
-
377
-
378
-
379
-
380
-
381
-
382
-
383
-
384
-
385
-
386
-
387
-
388
-
389
-
390
-
391
-
392
-
393
-
394
-
395
-
396
-
397
-
398
-
399
-
400
-
401
-
402
-
403
-
404
-
405
-
406
-
407
-
408
-
409
-
410
-
411
-
412
-
413
-
414
-
415
-
416
-
417
-
418
-
419
-
420
-
421
-
422
-
423
-
424
-
425
-
426
-
427
-
428
-
429
-
430
-
431
-
432
-
433
-
434
-
435
-
436
-
437
-
438
 |
 |