Dell PowerConnect W Clearpass 100 Software 3.7 Deployment Guide - Page 263
Statistics and Metrics, Create Classifier
 |
View all Dell PowerConnect W Clearpass 100 Software manuals
Add to My Manuals
Save this manual to your list of manuals |
Page 263 highlights
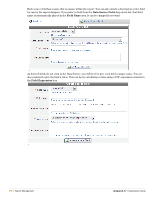
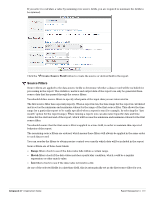
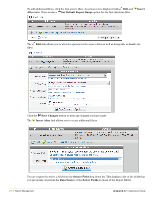
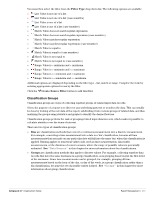
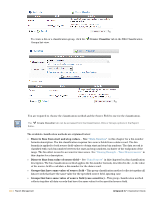
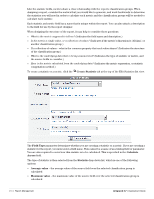
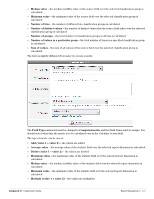
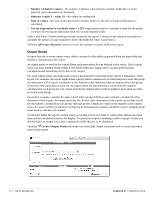
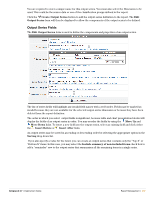
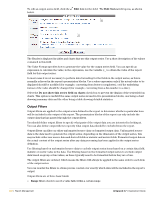
Time measurement: bin by days - See "Binning Example - Time Measurements" in this chapter for the bin classification method description. The bin classification method uses the specified date/time field to calculate a day number. Times that fall within the same day are assigned the same bin number. The bin offset is used to account for time zones as explained in the . Time measurement: bin by hours - This bin classification method uses the specified date/time field to calculate an hour number. Times that fall within the same hour are assigned the same bin number. Time measurement: bin by months - This bin classification method uses the specified date/time field to calculate a year and month number. Multiple months may be grouped together by specifying a bin size greater than 1; for example, to bin by quarters of the year, use 3 for the bin size. Times that fall within the same month or group of months are assigned the same bin number. Time measurement: bin by weeks - This bin classification method uses the specified date/time field to calculate a week number. Times that fall within the same week are assigned the same bin number. Time measurement: group by day of the month - This group classification uses the specified date/ time field to calculate the day of the month from 1 to 31. This is used as the group number, which collects together all data records that have the same day of the month. Time measurement: group by day of the week - This group classification uses the specified date/ time field to calculate the day of the week, from 0 to 6 where 0 is Sunday and 6 is Saturday. This is used as the group number, which collects together all data records that have the same day of the week. Time measurement: group by hour of the day - This group classification uses the specified date/time field to calculate the hour of day, from 0 to 23 where 0 is midnight, 12 is midday and 23 is 11 pm. This is used as the group number, which collects together all data records that have the same hour of the day. Time measurement: group by month of the year - This group classification uses the specified date/ time field to calculate the month of the year, from 1 to 12 where 1 is January and 12 is December. This is used as the group number, which collects together all data records that have the same month of the year. The remaining options in the form will change depending on your selection. See "Resetting Report Definitions" in this chapter for more information about binning and grouping classification methods. Click the Create Classifier button to define the classification group in the report. Statistics and Metrics Statistics are fields with values that are calculated from a group of source fields. For example, the total sum of all fields in a particular group would be a statistic field. Define statistic fields for any item of data over which you want to calculate some kind of summary information, such as a count, sum or average. To select which classification group to use for a statistic or metric field, consider which items you want to calculate across. This is called a 'dimension' of the report. To calculate a single statistic for all the items in a particular group, select that group as the classification group. To calculate a single statistic over all the items in the report, select the 'All data' dimension of the report. There is a close relationship between statistics and classification groups. In general, you should define classification groups to define how you want to break up the report data, then define statistic fields to extract the desired information about those groups. Metrics are fields with values calculated from other statistics. For example, converting a total sum to a cost by multiplying by a rate would be a metric field. Define metric fields to calculate quantities that are related to the report statistics, such as averages, costs or performance measurements. To derive a metric from one or more statistics, the metric must be calculated using the same dimension of the report as for the statistics. Amigopod 3.7 | Deployment Guide Report Management | 263
-
 1
1 -
2
-
3
-
4
-
5
-
6
-
7
-
8
-
9
-
10
-
11
-
12
-
13
-
14
-
15
-
16
-
17
-
18
-
19
-
20
-
21
-
22
-
23
-
24
-
25
-
26
-
27
-
28
-
29
-
30
-
31
-
32
-
33
-
34
-
35
-
36
-
37
-
38
-
39
-
40
-
41
-
42
-
43
-
44
-
45
-
46
-
47
-
48
-
49
-
50
-
51
-
52
-
53
-
54
-
55
-
56
-
57
-
58
-
59
-
60
-
61
-
62
-
63
-
64
-
65
-
66
-
67
-
68
-
69
-
70
-
71
-
72
-
73
-
74
-
75
-
76
-
77
-
78
-
79
-
80
-
81
-
82
-
83
-
84
-
85
-
86
-
87
-
88
-
89
-
90
-
91
-
92
-
93
-
94
-
95
-
96
-
97
-
98
-
99
-
100
-
101
-
102
-
103
-
104
-
105
-
106
-
107
-
108
-
109
-
110
-
111
-
112
-
113
-
114
-
115
-
116
-
117
-
118
-
119
-
120
-
121
-
122
-
123
-
124
-
125
-
126
-
127
-
128
-
129
-
130
-
131
-
132
-
133
-
134
-
135
-
136
-
137
-
138
-
139
-
140
-
141
-
142
-
143
-
144
-
145
-
146
-
147
-
148
-
149
-
150
-
151
-
152
-
153
-
154
-
155
-
156
-
157
-
158
-
159
-
160
-
161
-
162
-
163
-
164
-
165
-
166
-
167
-
168
-
169
-
170
-
171
-
172
-
173
-
174
-
175
-
176
-
177
-
178
-
179
-
180
-
181
-
182
-
183
-
184
-
185
-
186
-
187
-
188
-
189
-
190
-
191
-
192
-
193
-
194
-
195
-
196
-
197
-
198
-
199
-
200
-
201
-
202
-
203
-
204
-
205
-
206
-
207
-
208
-
209
-
210
-
211
-
212
-
213
-
214
-
215
-
216
-
217
-
218
-
219
-
220
-
221
-
222
-
223
-
224
-
225
-
226
-
227
-
228
-
229
-
230
-
231
-
232
-
233
-
234
-
235
-
236
-
237
-
238
-
239
-
240
-
241
-
242
-
243
-
244
-
245
-
246
-
247
-
248
-
249
-
250
-
251
-
252
-
253
-
254
-
255
-
256
-
257
-
 258
258 -
 259
259 -
 260
260 -
 261
261 -
 262
262 -
 263
263 -
 264
264 -
 265
265 -
 266
266 -
 267
267 -
 268
268 -
269
-
270
-
271
-
272
-
273
-
274
-
275
-
276
-
277
-
278
-
279
-
280
-
281
-
282
-
283
-
284
-
285
-
286
-
287
-
288
-
289
-
290
-
291
-
292
-
293
-
294
-
295
-
296
-
297
-
298
-
299
-
300
-
301
-
302
-
303
-
304
-
305
-
306
-
307
-
308
-
309
-
310
-
311
-
312
-
313
-
314
-
315
-
316
-
317
-
318
-
319
-
320
-
321
-
322
-
323
-
324
-
325
-
326
-
327
-
328
-
329
-
330
-
331
-
332
-
333
-
334
-
335
-
336
-
337
-
338
-
339
-
340
-
341
-
342
-
343
-
344
-
345
-
346
-
347
-
348
-
349
-
350
-
351
-
352
-
353
-
354
-
355
-
356
-
357
-
358
-
359
-
360
-
361
-
362
-
363
-
364
-
365
-
366
-
367
-
368
-
369
-
370
-
371
-
372
-
373
-
374
-
375
-
376
-
377
-
378
-
379
-
380
-
381
-
382
-
383
-
384
-
385
-
386
-
387
-
388
-
389
-
390
-
391
-
392
-
393
-
394
-
395
-
396
-
397
-
398
-
399
-
400
-
401
-
402
-
403
-
404
-
405
-
406
-
407
-
408
-
409
-
410
-
411
-
412
-
413
-
414
-
415
-
416
-
417
-
418
-
419
-
420
-
421
-
422
-
423
-
424
-
425
-
426
-
427
-
428
-
429
-
430
-
431
-
432
-
433
-
434
-
435
-
436
-
437
-
438
 |
 |