HP Xw460c HP Insight Control Environment User Guide - Page 131
Host buses, Sample PMP system summary report
 |
View all HP Xw460c manuals
Add to My Manuals
Save this manual to your list of manuals |
Page 131 highlights
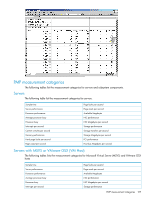
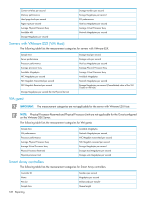
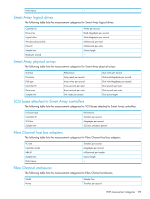
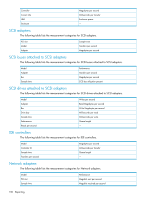
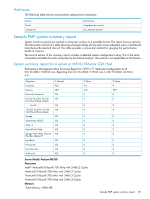
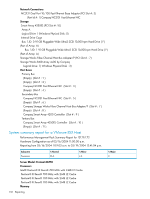
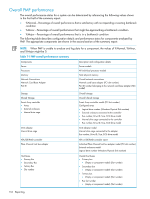
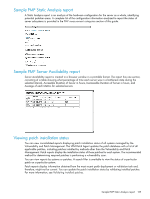
Host buses The following table lists the measurement categories for host buses. Device Name Sample time Performance Megabytes per second Bus utilization percent Sample PMP system summary report System Summary reports are created in a browser window in a printable format. The report has two sections. The first section consists of a table showing what percentage of time each server subsystem was in a bottleneck state during the selected interval. This table provides a convenient method for gauging the performance health of a server. The second section of the summary report includes a detailed system configuration listing. This is the same information available for each component in the Online Analysis. This section is not applicable to VM Guests. System summary report for a server or MSVS/VMware GSX Host Performance Management Pack Summary Report for 131.111.1.71 Hardware Configuration as of 03/16/2004 11:00:00 a.m. Reporting from 03/16/2004 11:19:03 a.m. to 03/19/2004 12:41:04 p.m. Subsystem Processors Memory Network Connections NC3131 Dual Port 10/100 Fast Ethernet Base Adapter Port ID: 1 NC3131 Dual Port 10/100 Fast Ethernet Base Adapter Storage Smart Array 4250ES Array: A Internal Drive Cage Storage Works Fibre Channel Host Bus Adapter/P Host Buses Primary Bus Secondary Bus Tertiary Bus % Normal 96.0 68.0 100 100 100 100 100 100 100 100 100 100 100 100 100 % Minor 4.0 14.0 0 0 0 0 0 0 0 0 0 0 0 0 0 % Major 0 18.0 0 0 0 0 0 0 0 0 0 0 0 0 0 Server Model: ProLiant ML750 Processors Intel® Pentium® III Xeon® 700 MHz with 2-MB L2 Cache Pentium® III Xeon® 700 MHz with 2-MB L2 Cache Pentium® III Xeon® 700 MHz with 2-MB L2 Cache Pentium® III Xeon® 700 MHz with 2-MB L2 Cache Memory Total Memory: 4096 MB Sample PMP system summary report 131
-
 1
1 -
2
-
3
-
4
-
5
-
6
-
7
-
8
-
9
-
10
-
11
-
12
-
13
-
14
-
15
-
16
-
17
-
18
-
19
-
20
-
21
-
22
-
23
-
24
-
25
-
26
-
27
-
28
-
29
-
30
-
31
-
32
-
33
-
34
-
35
-
36
-
37
-
38
-
39
-
40
-
41
-
42
-
43
-
44
-
45
-
46
-
47
-
48
-
49
-
50
-
51
-
52
-
53
-
54
-
55
-
56
-
57
-
58
-
59
-
60
-
61
-
62
-
63
-
64
-
65
-
66
-
67
-
68
-
69
-
70
-
71
-
72
-
73
-
74
-
75
-
76
-
77
-
78
-
79
-
80
-
81
-
82
-
83
-
84
-
85
-
86
-
87
-
88
-
89
-
90
-
91
-
92
-
93
-
94
-
95
-
96
-
97
-
98
-
99
-
100
-
101
-
102
-
103
-
104
-
105
-
106
-
107
-
108
-
109
-
110
-
111
-
112
-
113
-
114
-
115
-
116
-
117
-
118
-
119
-
120
-
121
-
122
-
123
-
124
-
125
-
 126
126 -
 127
127 -
 128
128 -
 129
129 -
 130
130 -
 131
131 -
 132
132 -
 133
133 -
 134
134 -
 135
135 -
 136
136 -
137
-
138
-
139
-
140
-
141
-
142
-
143
-
144
-
145
-
146
-
147
-
148
-
149
-
150
-
151
-
152
-
153
-
154
-
155
-
156
-
157
-
158
-
159
-
160
-
161
-
162
-
163
-
164
-
165
-
166
-
167
-
168
-
169
-
170
-
171
-
172
-
173
-
174
-
175
-
176
-
177
-
178
-
179
-
180
-
181
 |
 |