HP Xw460c HP Insight Control Environment User Guide - Page 55
Displaying the drive, Displaying the inventory, ID 0: 146G 15K U320 Array
 |
View all HP Xw460c manuals
Add to My Manuals
Save this manual to your list of manuals |
Page 55 highlights
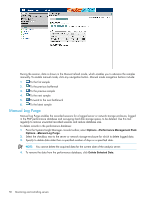
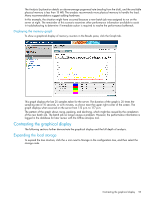
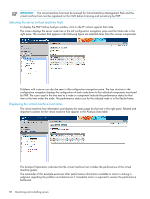
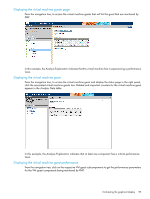
Displaying the drive Click the ID 0: 146G 15K U320 (Array A) drive. The graph displays the performance statistics for that drive over the last 4.16 minutes. The graph in the previous figure trends upward to the right and levels high. These characteristics indicate that the system is not returning to normal and might require immediate action. Displaying the inventory To display information for the selected drive, select the Inventory tab. Contrasting the graphical display 55
-
 1
1 -
2
-
3
-
4
-
5
-
6
-
7
-
8
-
9
-
10
-
11
-
12
-
13
-
14
-
15
-
16
-
17
-
18
-
19
-
20
-
21
-
22
-
23
-
24
-
25
-
26
-
27
-
28
-
29
-
30
-
31
-
32
-
33
-
34
-
35
-
36
-
37
-
38
-
39
-
40
-
41
-
42
-
43
-
44
-
45
-
46
-
47
-
48
-
49
-
 50
50 -
 51
51 -
 52
52 -
 53
53 -
 54
54 -
 55
55 -
 56
56 -
 57
57 -
 58
58 -
 59
59 -
 60
60 -
61
-
62
-
63
-
64
-
65
-
66
-
67
-
68
-
69
-
70
-
71
-
72
-
73
-
74
-
75
-
76
-
77
-
78
-
79
-
80
-
81
-
82
-
83
-
84
-
85
-
86
-
87
-
88
-
89
-
90
-
91
-
92
-
93
-
94
-
95
-
96
-
97
-
98
-
99
-
100
-
101
-
102
-
103
-
104
-
105
-
106
-
107
-
108
-
109
-
110
-
111
-
112
-
113
-
114
-
115
-
116
-
117
-
118
-
119
-
120
-
121
-
122
-
123
-
124
-
125
-
126
-
127
-
128
-
129
-
130
-
131
-
132
-
133
-
134
-
135
-
136
-
137
-
138
-
139
-
140
-
141
-
142
-
143
-
144
-
145
-
146
-
147
-
148
-
149
-
150
-
151
-
152
-
153
-
154
-
155
-
156
-
157
-
158
-
159
-
160
-
161
-
162
-
163
-
164
-
165
-
166
-
167
-
168
-
169
-
170
-
171
-
172
-
173
-
174
-
175
-
176
-
177
-
178
-
179
-
180
-
181
 |
 |
Displaying the drive
Click the
ID 0: 146G 15K U320 (Array A)
drive. The graph displays the performance statistics for that drive
over the last 4.16 minutes.
The graph in the previous figure trends upward to the right and levels high. These characteristics indicate
that the system is not returning to normal and might require immediate action.
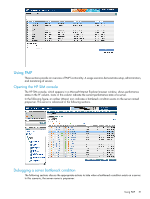
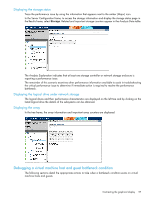
Displaying the inventory
To display information for the selected drive, select the
Inventory
tab.
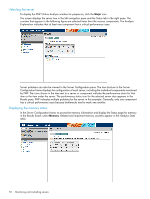
Contrasting the graphical display
55