HP Xw460c HP Insight Control Environment User Guide - Page 64
Data reporting, Previous, Reports, Performance Management Pack Reports
 |
View all HP Xw460c manuals
Add to My Manuals
Save this manual to your list of manuals |
Page 64 highlights
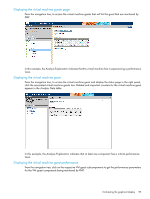
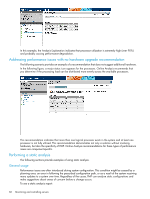
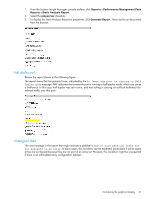
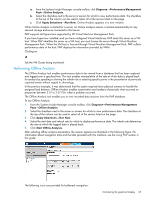
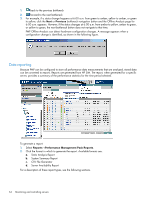
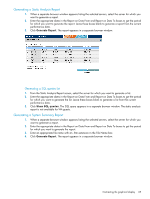
1. back to the previous bottleneck 2. forward to the next bottleneck 3. For example, if a status change happens at 6:00 a.m. from green to amber, yellow to amber, or green to yellow, click the Next or Previous bottleneck navigation button and the Offline Analysis page for 6:00 a.m. appears. However, if the status changes at 6:00 a.m. from amber to yellow, amber to green, or yellow to green, the next bottleneck button does not navigate to that time. PMP Offline Analysis can detect hardware configuration changes. A message appears when a configuration change is identified, as shown in the following figure. Data reporting Because PMP can be configured to store all performance data measurements that are analyzed, stored data can be converted to reports. Reports are generated from HP SIM. The report, when generated for a specific server, provides a summary of the performance statistics for the time period selected. To generate a report: 1. Select Reports→Performance Management Pack Reports. 2. Click the format in which to generate the report. Available formats are: a. Static Analysis Report b. System Summary Report c. CSV File Generator d. Server Availability Report For a description of these report types, see the following sections. 64 Monitoring and controlling servers
-
 1
1 -
2
-
3
-
4
-
5
-
6
-
7
-
8
-
9
-
10
-
11
-
12
-
13
-
14
-
15
-
16
-
17
-
18
-
19
-
20
-
21
-
22
-
23
-
24
-
25
-
26
-
27
-
28
-
29
-
30
-
31
-
32
-
33
-
34
-
35
-
36
-
37
-
38
-
39
-
40
-
41
-
42
-
43
-
44
-
45
-
46
-
47
-
48
-
49
-
50
-
51
-
52
-
53
-
54
-
55
-
56
-
57
-
58
-
 59
59 -
 60
60 -
 61
61 -
 62
62 -
 63
63 -
 64
64 -
 65
65 -
 66
66 -
 67
67 -
 68
68 -
 69
69 -
70
-
71
-
72
-
73
-
74
-
75
-
76
-
77
-
78
-
79
-
80
-
81
-
82
-
83
-
84
-
85
-
86
-
87
-
88
-
89
-
90
-
91
-
92
-
93
-
94
-
95
-
96
-
97
-
98
-
99
-
100
-
101
-
102
-
103
-
104
-
105
-
106
-
107
-
108
-
109
-
110
-
111
-
112
-
113
-
114
-
115
-
116
-
117
-
118
-
119
-
120
-
121
-
122
-
123
-
124
-
125
-
126
-
127
-
128
-
129
-
130
-
131
-
132
-
133
-
134
-
135
-
136
-
137
-
138
-
139
-
140
-
141
-
142
-
143
-
144
-
145
-
146
-
147
-
148
-
149
-
150
-
151
-
152
-
153
-
154
-
155
-
156
-
157
-
158
-
159
-
160
-
161
-
162
-
163
-
164
-
165
-
166
-
167
-
168
-
169
-
170
-
171
-
172
-
173
-
174
-
175
-
176
-
177
-
178
-
179
-
180
-
181
 |
 |