HP Xw460c HP Insight Control Environment User Guide - Page 47
Online and Offline Analysis, Systems detail frame, Server Tree frame, Diagnose
 |
View all HP Xw460c manuals
Add to My Manuals
Save this manual to your list of manuals |
Page 47 highlights
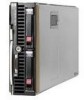
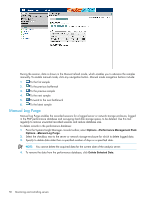
Online and Offline Analysis The PMP Online and Offline Analysis tools provide an intuitive interface to detail the performance status and inventory of monitored servers and processor memory, local and external storage, network storage, network connections, host bus, and virtual machine host components for each server. The tools provided for Online and Offline Analysis are similar in overall functionality. The major difference in performing Offline Analysis is that the data comes from a database rather than a real-time data stream. Additionally, for performance analysis in a static setting, PMP provides many tools to assist in monitoring server performance. For more information about Offline Analysis, see the Offline Analysis section in this guide. When you select a monitored server icon from the PF column of the Systems Insight Manager console or when you select Diagnose→Performance Management Pack→Online Analysis from the console toolbar, the PMP Online Analysis screen appears in a new browser window, as shown in the following screen. The analysis starts in the performance status view for the server. Systems detail frame The Systems detail frame appears at the top left side of the browser window below the banner and provides the following information: 1. Server name - Displays the name of the server currently being monitored 2. Server OS - Displays the operating system version of the server currently being monitored 3. Server IP - Displays the IP address assigned to the server currently being monitored including IPv6 address for the NIC if available 4. Sample Rate - Displays the frequency with which the agents are collecting performance data on the monitored server 5. Samples for Status - Displays the number of samples averaged to determine system performance status 6. Alert - Indicates if alerts are to be sent when certain server performance status conditions occur 7. Log - Indicates if the performance data is currently being logged for the selected server 8. Set Threshold - Provides a link for modifying the performance threshold values for the selected server Server Tree frame The Server Tree frame appears on the left side of the browser window. This frame is used to navigate between system components. Component performance and status information appear in a hierarchical tree with nodes for each level of the component. This frame provides a view of the server, processors, memory, network connections, storage, host bus components, and virtual machine host components. Online and Offline Analysis 47
-
 1
1 -
2
-
3
-
4
-
5
-
6
-
7
-
8
-
9
-
10
-
11
-
12
-
13
-
14
-
15
-
16
-
17
-
18
-
19
-
20
-
21
-
22
-
23
-
24
-
25
-
26
-
27
-
28
-
29
-
30
-
31
-
32
-
33
-
34
-
35
-
36
-
37
-
38
-
39
-
40
-
41
-
 42
42 -
 43
43 -
 44
44 -
 45
45 -
 46
46 -
 47
47 -
 48
48 -
 49
49 -
 50
50 -
 51
51 -
 52
52 -
53
-
54
-
55
-
56
-
57
-
58
-
59
-
60
-
61
-
62
-
63
-
64
-
65
-
66
-
67
-
68
-
69
-
70
-
71
-
72
-
73
-
74
-
75
-
76
-
77
-
78
-
79
-
80
-
81
-
82
-
83
-
84
-
85
-
86
-
87
-
88
-
89
-
90
-
91
-
92
-
93
-
94
-
95
-
96
-
97
-
98
-
99
-
100
-
101
-
102
-
103
-
104
-
105
-
106
-
107
-
108
-
109
-
110
-
111
-
112
-
113
-
114
-
115
-
116
-
117
-
118
-
119
-
120
-
121
-
122
-
123
-
124
-
125
-
126
-
127
-
128
-
129
-
130
-
131
-
132
-
133
-
134
-
135
-
136
-
137
-
138
-
139
-
140
-
141
-
142
-
143
-
144
-
145
-
146
-
147
-
148
-
149
-
150
-
151
-
152
-
153
-
154
-
155
-
156
-
157
-
158
-
159
-
160
-
161
-
162
-
163
-
164
-
165
-
166
-
167
-
168
-
169
-
170
-
171
-
172
-
173
-
174
-
175
-
176
-
177
-
178
-
179
-
180
-
181
 |
 |