HP Xw460c HP Insight Control Environment User Guide - Page 56
Debugging a network storage bottleneck condition, Selecting the server
 |
View all HP Xw460c manuals
Add to My Manuals
Save this manual to your list of manuals |
Page 56 highlights
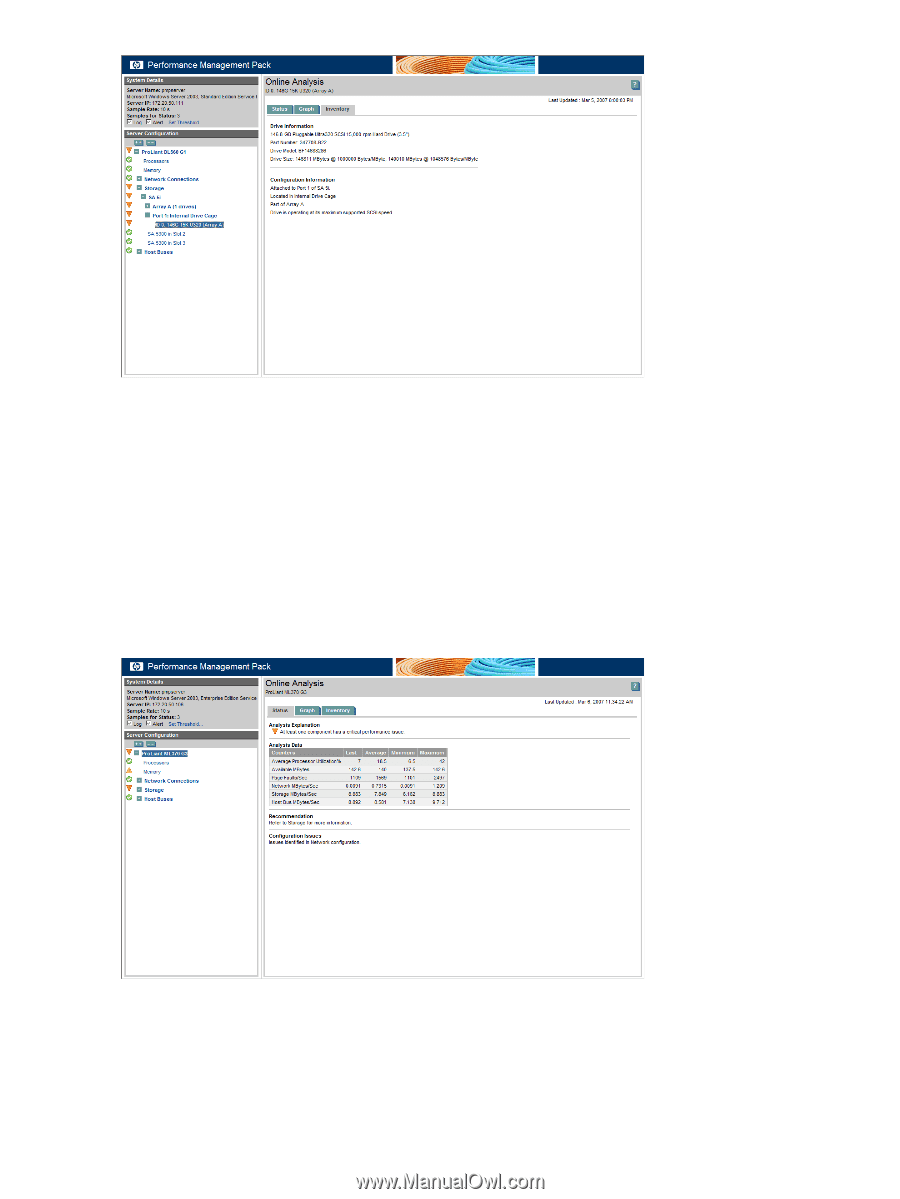
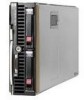
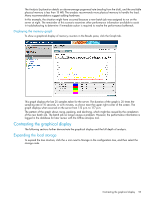
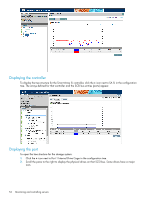
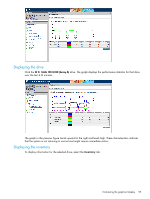
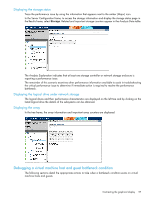
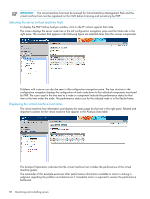
Hardware or configuration details for the currently selected device appear. Debugging a network storage bottleneck condition The following sections detail the appropriate responses when a bottleneck condition exists on network storage. In this scenario, the server name is pmp-client2k, sharing network storage MSA1500cs. An amber (Major) icon in the PF column indicates a bottleneck condition exists on the server pmp-client2k. Selecting the server To display the PMP Online Analysis window for pmp-client2k, click the Major icon. The screen displays the server tree in the Server Configuration frame and the Status tab in the Results frame. The counters that appear in the following figure are selected items from the various components. The Analysis Explanation indicates that at least one component has a critical performance issue. Server problems can also be seen within the Server Configuration frame. The tree structure in the Server Configuration frame displays the configuration of each server, including individual components monitored by PMP. The icons appearing in the tree next to a server or component indicate the performance status for that item or the item under the server. The performance status icon for the selected server also appears in the Results frame. PMP indicates multiple problems for the server in this example. Generally, only one component has a critical performance issue because bottlenecks tend to mask one another. 56 Monitoring and controlling servers
-
 1
1 -
2
-
3
-
4
-
5
-
6
-
7
-
8
-
9
-
10
-
11
-
12
-
13
-
14
-
15
-
16
-
17
-
18
-
19
-
20
-
21
-
22
-
23
-
24
-
25
-
26
-
27
-
28
-
29
-
30
-
31
-
32
-
33
-
34
-
35
-
36
-
37
-
38
-
39
-
40
-
41
-
42
-
43
-
44
-
45
-
46
-
47
-
48
-
49
-
50
-
 51
51 -
 52
52 -
 53
53 -
 54
54 -
 55
55 -
 56
56 -
 57
57 -
 58
58 -
 59
59 -
 60
60 -
 61
61 -
62
-
63
-
64
-
65
-
66
-
67
-
68
-
69
-
70
-
71
-
72
-
73
-
74
-
75
-
76
-
77
-
78
-
79
-
80
-
81
-
82
-
83
-
84
-
85
-
86
-
87
-
88
-
89
-
90
-
91
-
92
-
93
-
94
-
95
-
96
-
97
-
98
-
99
-
100
-
101
-
102
-
103
-
104
-
105
-
106
-
107
-
108
-
109
-
110
-
111
-
112
-
113
-
114
-
115
-
116
-
117
-
118
-
119
-
120
-
121
-
122
-
123
-
124
-
125
-
126
-
127
-
128
-
129
-
130
-
131
-
132
-
133
-
134
-
135
-
136
-
137
-
138
-
139
-
140
-
141
-
142
-
143
-
144
-
145
-
146
-
147
-
148
-
149
-
150
-
151
-
152
-
153
-
154
-
155
-
156
-
157
-
158
-
159
-
160
-
161
-
162
-
163
-
164
-
165
-
166
-
167
-
168
-
169
-
170
-
171
-
172
-
173
-
174
-
175
-
176
-
177
-
178
-
179
-
180
-
181
 |
 |