HP Xw460c HP Insight Control Environment User Guide - Page 63
Performing Offline Analysis, Diagnose, Performance Management, Online Analysis, Apply Selections
 |
View all HP Xw460c manuals
Add to My Manuals
Save this manual to your list of manuals |
Page 63 highlights
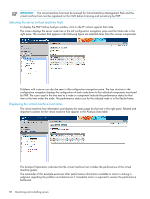
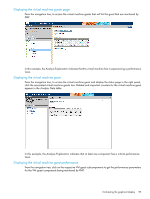
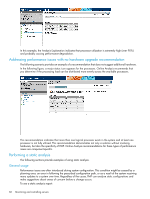
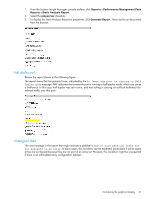
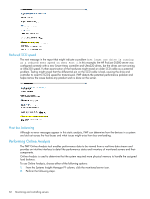
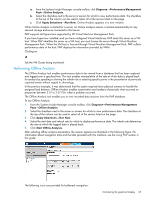
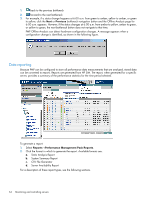
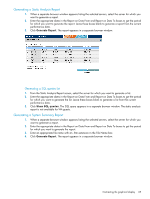
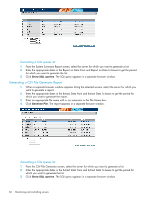
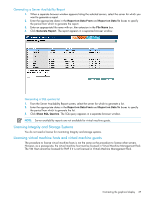
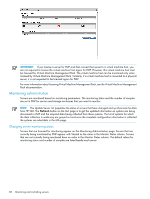
a. From the Systems Insight Manager console toolbar, click Diagnose→Performance Management Pack→Online Analysis. b. Select the checkbox next to the server or servers for which to view performance data. The checkbox at the top of the column can be used to select all of the servers listed on the page. c. Click Apply Selections→Run Now. Online Analysis appears in a new window. When Online Analysis is started for a server, an Online Analysis session is started automatically for any network storage enclosure connected to that server. PMP supports all Hypervisors supported by HP Virtual Machine Management Pack. If you have hypervisor installed, and you have configured Virtual Machines, PMP treats this server as a VM host. When PMP identifies the server as a VM host, you must license the server through Virtual Machine Management Pack. When the VM host is licensed through Virtual Machine Management Pack, PMP collects performance data of the host. PMP displays the information provided by VMM. Clicking on lists the VM Guests being monitored. Performing Offline Analysis The Offline Analysis tool enables performance data to be viewed from a database that has been captured and logged over a specified time. This tool enables manipulation of the rate at which data is played back for analysis by speeding or slowing the refresh rate or selecting specific points in the presentation of previously captured events without regard to chronology. In the previous example, it was determined that the system required more physical memory to handle the assigned load balance. Offline Analysis enables examination and analysis of precisely what occurred on pmpserver between 3:01 to 3:37 P.M. when a problem occurred. The Offline Analysis tool enables you to view recorded data sessions from the PMP database. To use Offline Analysis: 1. From the Systems Insight Manager console toolbar, click Diagnose→Performance Management Pack→Offline Analysis. 2. Select the checkbox next to the server or servers for which to view performance data. The checkbox at the top of the column can be used to select all of the servers listed on the page. 3. Click Apply Selections→Run Now. 4. Select the start date and refresh rate for which to display performance data. The refresh rate determines the rate at which the logged data is played back. 5. Click Start Offline Analysis. After selecting offline analysis parameters, the session appears as illustrated in the following figure. For information about navigation tools and the tabs provided with this interface, see the Using PMP section in this guide. The following icons are provided for bottleneck navigation: Contrasting the graphical display 63
-
 1
1 -
2
-
3
-
4
-
5
-
6
-
7
-
8
-
9
-
10
-
11
-
12
-
13
-
14
-
15
-
16
-
17
-
18
-
19
-
20
-
21
-
22
-
23
-
24
-
25
-
26
-
27
-
28
-
29
-
30
-
31
-
32
-
33
-
34
-
35
-
36
-
37
-
38
-
39
-
40
-
41
-
42
-
43
-
44
-
45
-
46
-
47
-
48
-
49
-
50
-
51
-
52
-
53
-
54
-
55
-
56
-
57
-
 58
58 -
 59
59 -
 60
60 -
 61
61 -
 62
62 -
 63
63 -
 64
64 -
 65
65 -
 66
66 -
 67
67 -
 68
68 -
69
-
70
-
71
-
72
-
73
-
74
-
75
-
76
-
77
-
78
-
79
-
80
-
81
-
82
-
83
-
84
-
85
-
86
-
87
-
88
-
89
-
90
-
91
-
92
-
93
-
94
-
95
-
96
-
97
-
98
-
99
-
100
-
101
-
102
-
103
-
104
-
105
-
106
-
107
-
108
-
109
-
110
-
111
-
112
-
113
-
114
-
115
-
116
-
117
-
118
-
119
-
120
-
121
-
122
-
123
-
124
-
125
-
126
-
127
-
128
-
129
-
130
-
131
-
132
-
133
-
134
-
135
-
136
-
137
-
138
-
139
-
140
-
141
-
142
-
143
-
144
-
145
-
146
-
147
-
148
-
149
-
150
-
151
-
152
-
153
-
154
-
155
-
156
-
157
-
158
-
159
-
160
-
161
-
162
-
163
-
164
-
165
-
166
-
167
-
168
-
169
-
170
-
171
-
172
-
173
-
174
-
175
-
176
-
177
-
178
-
179
-
180
-
181
 |
 |