HP Xw460c HP Insight Control Environment User Guide - Page 71
Number of samples, Performance threshold setting, Modifying the sample rate, Modifying log days
 |
View all HP Xw460c manuals
Add to My Manuals
Save this manual to your list of manuals |
Page 71 highlights
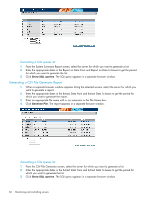
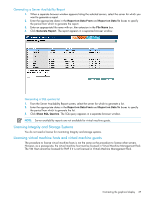
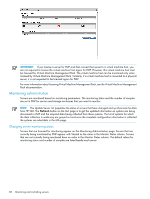
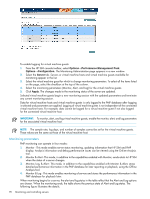
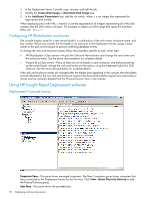
1. Row number 1: Monitoring is started, Alert and Log enabled. The results are Started, Tick and Tick in the table. 2. Row number 2: Monitoring, Alert and Log disabled. The results are Blank, Tick and Tick in the table reflecting the previous state of Alert and Log when the monitoring is stopped. 3. Row number 6: Monitoring is started, Alert enabled and Log disabled. The results are Started, Tick and Blank reflecting the current status whenever the monitoring is started. 4. Row number 7: Monitoring, Alert and Log disabled. The results are Blank, Tick and Blank reflecting the previous state of the Alert and Log when the monitoring is stopped. Number of samples The Number of samples setting enables adjustment of PMP analysis to account for highly variable or stable system performance. A higher number of samples results in smaller average changes in performance. Therefore, it generates fewer performance bottleneck indications for a server whose performance changes significantly. Fewer samples can be used for servers with more stable performance or when the sampling rate is higher. Performance threshold setting The hyperlink To Set Performance Threshold values click here enables setting the performance threshold values for the selected server in a separate page. Modifying the sample rate PMP does not control the amount of time between samples. Instead, the sample rate (data collection interval) is set from within the HP Management Agents. The Management Agents can be modified from the Control Panel or Internet Explorer. The sample rate for a network storage enclosure is determined by the servers to which the enclosure is connected. The sample rate for storage enclosures is the highest sample rate of the connected servers. Modifying log days The log days option enables you to choose the number of days for which you need data logged. You can select a value for this option using the two lists. The first list contains values from 1 through 20. The second list has options such as days, months, and years. For example, if you select 2 in the first list and Years in the second list, data is logged for 730 days. The data that was logged first is replaced cyclically as new data is logged. Modifying Management Agents from the Control Panel 1. From the Control Panel, open HP Management Agents. 2. Click the SNMP Settings tab. 3. Modify the Data Collection Interval (sample rate) as necessary. Contrasting the graphical display 71
-
 1
1 -
2
-
3
-
4
-
5
-
6
-
7
-
8
-
9
-
10
-
11
-
12
-
13
-
14
-
15
-
16
-
17
-
18
-
19
-
20
-
21
-
22
-
23
-
24
-
25
-
26
-
27
-
28
-
29
-
30
-
31
-
32
-
33
-
34
-
35
-
36
-
37
-
38
-
39
-
40
-
41
-
42
-
43
-
44
-
45
-
46
-
47
-
48
-
49
-
50
-
51
-
52
-
53
-
54
-
55
-
56
-
57
-
58
-
59
-
60
-
61
-
62
-
63
-
64
-
65
-
 66
66 -
 67
67 -
 68
68 -
 69
69 -
 70
70 -
 71
71 -
 72
72 -
 73
73 -
 74
74 -
 75
75 -
 76
76 -
77
-
78
-
79
-
80
-
81
-
82
-
83
-
84
-
85
-
86
-
87
-
88
-
89
-
90
-
91
-
92
-
93
-
94
-
95
-
96
-
97
-
98
-
99
-
100
-
101
-
102
-
103
-
104
-
105
-
106
-
107
-
108
-
109
-
110
-
111
-
112
-
113
-
114
-
115
-
116
-
117
-
118
-
119
-
120
-
121
-
122
-
123
-
124
-
125
-
126
-
127
-
128
-
129
-
130
-
131
-
132
-
133
-
134
-
135
-
136
-
137
-
138
-
139
-
140
-
141
-
142
-
143
-
144
-
145
-
146
-
147
-
148
-
149
-
150
-
151
-
152
-
153
-
154
-
155
-
156
-
157
-
158
-
159
-
160
-
161
-
162
-
163
-
164
-
165
-
166
-
167
-
168
-
169
-
170
-
171
-
172
-
173
-
174
-
175
-
176
-
177
-
178
-
179
-
180
-
181
 |
 |