HP Xw460c HP Insight Control Environment User Guide - Page 58
Selecting the server (virtual machine host), Displaying the virtual machine host status
 |
View all HP Xw460c manuals
Add to My Manuals
Save this manual to your list of manuals |
Page 58 highlights
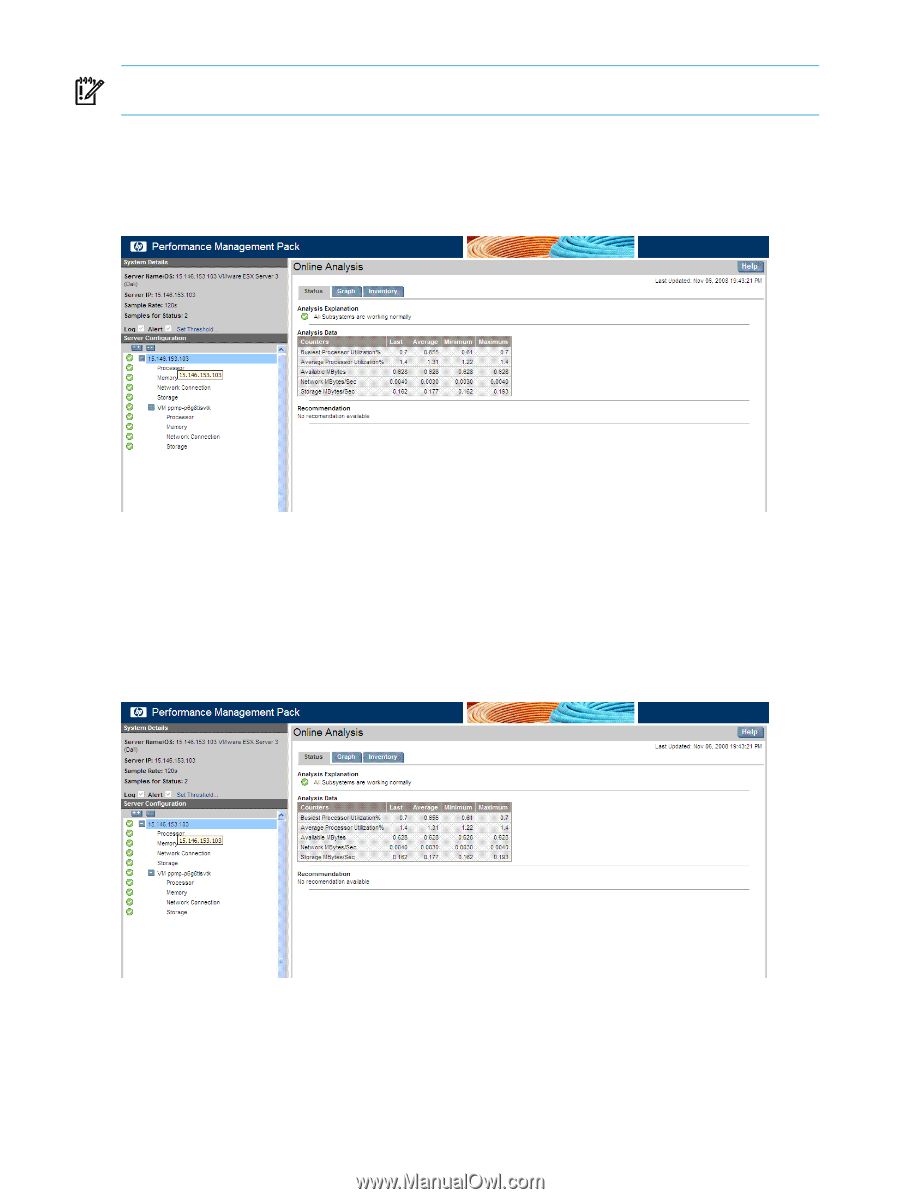
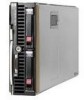
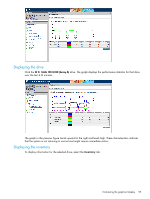
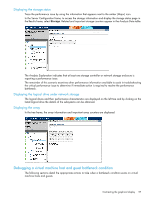
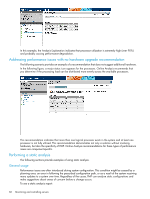
IMPORTANT: The virtual machine host must be licensed for Virtual Machine Management Pack and the virtual machine host must be registered on the CMS before licensing and monitoring by PMP. Selecting the server (virtual machine host) To display the PMP Online Analysis window, click on the PF column against that node. The screen displays the server node tree in the left configuration navigation pane and the Status tab in the right pane. The counters that appear in the following figure are selected items from the various components. Problems with a server can also be seen in the configuration navigation pane. The tree structure in the configuration navigation displays the configuration of each node down to the individual components monitored by PMP. The icons used in the tree next to a node or component indicate the performance status for that item or the item under the node. The performance status icon for the selected node is in the Results frame. Displaying the virtual machine host status The virtual machine host information and display the status page for the host in the right pane. Related and important counters for the virtual machine host appear in the Analysis Data table. The Analysis Explanation indicates that the virtual machine host includes the performance of the virtual machine guests. The remainder of this example examines other performance information available to assist in making a judgment regarding the problem and determines if immediate action is required to resolve the performance bottleneck. 58 Monitoring and controlling servers
-
 1
1 -
2
-
3
-
4
-
5
-
6
-
7
-
8
-
9
-
10
-
11
-
12
-
13
-
14
-
15
-
16
-
17
-
18
-
19
-
20
-
21
-
22
-
23
-
24
-
25
-
26
-
27
-
28
-
29
-
30
-
31
-
32
-
33
-
34
-
35
-
36
-
37
-
38
-
39
-
40
-
41
-
42
-
43
-
44
-
45
-
46
-
47
-
48
-
49
-
50
-
51
-
52
-
 53
53 -
 54
54 -
 55
55 -
 56
56 -
 57
57 -
 58
58 -
 59
59 -
 60
60 -
 61
61 -
 62
62 -
 63
63 -
64
-
65
-
66
-
67
-
68
-
69
-
70
-
71
-
72
-
73
-
74
-
75
-
76
-
77
-
78
-
79
-
80
-
81
-
82
-
83
-
84
-
85
-
86
-
87
-
88
-
89
-
90
-
91
-
92
-
93
-
94
-
95
-
96
-
97
-
98
-
99
-
100
-
101
-
102
-
103
-
104
-
105
-
106
-
107
-
108
-
109
-
110
-
111
-
112
-
113
-
114
-
115
-
116
-
117
-
118
-
119
-
120
-
121
-
122
-
123
-
124
-
125
-
126
-
127
-
128
-
129
-
130
-
131
-
132
-
133
-
134
-
135
-
136
-
137
-
138
-
139
-
140
-
141
-
142
-
143
-
144
-
145
-
146
-
147
-
148
-
149
-
150
-
151
-
152
-
153
-
154
-
155
-
156
-
157
-
158
-
159
-
160
-
161
-
162
-
163
-
164
-
165
-
166
-
167
-
168
-
169
-
170
-
171
-
172
-
173
-
174
-
175
-
176
-
177
-
178
-
179
-
180
-
181
 |
 |