HP Xw460c HP Insight Control Environment User Guide - Page 134
Overall PMP performance
 |
View all HP Xw460c manuals
Add to My Manuals
Save this manual to your list of manuals |
Page 134 highlights
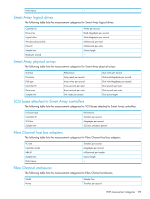
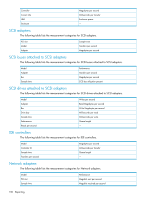
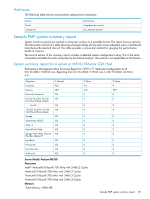
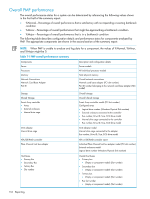
Overall PMP performance The overall performance status for a system can be determined by referencing the following values shown in the first half of the summary report: • %Normal-Percentage of overall performance that is satisfactory with no impending or existing bottleneck condition • %Minor-Percentage of overall performance that might be approaching a bottleneck condition • %Major-Percentage of overall performance that is in a bottleneck condition The following table describes configuration details and performance status for components analyzed by PMP. The appropriate components are shown in the second section of the summary report. NOTE: When PMP is unable to analyze and log data for a component, the values of %Normal, %Minor, and %Major might be 0. Table 7-1 PMP overall performance summary Components Server Processors Memory Network Connections Network Card Base Adapter Port ID Description and configuration details Server models All individual processor models Total physical memory Overall network connections Network card base adapter (PCI slot number) Port ID number belonging to the network card base adapter (NIC model) Storage Shared Storage Smart Array controller • Array • External enclosure • Internal drive cage Overall storage Overall shared storage Smart Array controller model (PCI slot number) Configured array • Logical drive number (Windows Physical Disk number) • External enclosure connected to the controller • Bus number, Drive ID, Size, SCSI drive model • Internal drive cage connected to the controller • Bus number, Drive ID, Size, SCSI drive model SCSI adapter Internal drive cage SCSI adapter model Internal drive cage connected to the adapter Bus number, Drive ID, Size, SCSI drive model ATA/IDE RAID controller Fibre Channel host bus adapter ATA or IDE RAID controller name Individual Fibre Channel host bus adapter model (PCI slot number) External enclosure model Logical drive number (Windows Physical Disk number) Host Buses • Primary Bus • Secondary Bus • Tertiary Bus • Slot number Overall host buses • Primary bus • (Empty or component model) (Slot number) • Secondary bus • (Empty or component model) (Slot number) • Tertiary bus • (Empty or component model) (Slot number) • Bus slot number • (Empty or component model) (Slot number) 134 Reporting
-
 1
1 -
2
-
3
-
4
-
5
-
6
-
7
-
8
-
9
-
10
-
11
-
12
-
13
-
14
-
15
-
16
-
17
-
18
-
19
-
20
-
21
-
22
-
23
-
24
-
25
-
26
-
27
-
28
-
29
-
30
-
31
-
32
-
33
-
34
-
35
-
36
-
37
-
38
-
39
-
40
-
41
-
42
-
43
-
44
-
45
-
46
-
47
-
48
-
49
-
50
-
51
-
52
-
53
-
54
-
55
-
56
-
57
-
58
-
59
-
60
-
61
-
62
-
63
-
64
-
65
-
66
-
67
-
68
-
69
-
70
-
71
-
72
-
73
-
74
-
75
-
76
-
77
-
78
-
79
-
80
-
81
-
82
-
83
-
84
-
85
-
86
-
87
-
88
-
89
-
90
-
91
-
92
-
93
-
94
-
95
-
96
-
97
-
98
-
99
-
100
-
101
-
102
-
103
-
104
-
105
-
106
-
107
-
108
-
109
-
110
-
111
-
112
-
113
-
114
-
115
-
116
-
117
-
118
-
119
-
120
-
121
-
122
-
123
-
124
-
125
-
126
-
127
-
128
-
 129
129 -
 130
130 -
 131
131 -
 132
132 -
 133
133 -
 134
134 -
 135
135 -
 136
136 -
 137
137 -
 138
138 -
 139
139 -
140
-
141
-
142
-
143
-
144
-
145
-
146
-
147
-
148
-
149
-
150
-
151
-
152
-
153
-
154
-
155
-
156
-
157
-
158
-
159
-
160
-
161
-
162
-
163
-
164
-
165
-
166
-
167
-
168
-
169
-
170
-
171
-
172
-
173
-
174
-
175
-
176
-
177
-
178
-
179
-
180
-
181
 |
 |
