HP Xw460c HP Insight Control Environment User Guide - Page 59
Displaying the virtual machine guests appear in the Analysis Data table.
 |
View all HP Xw460c manuals
Add to My Manuals
Save this manual to your list of manuals |
Page 59 highlights
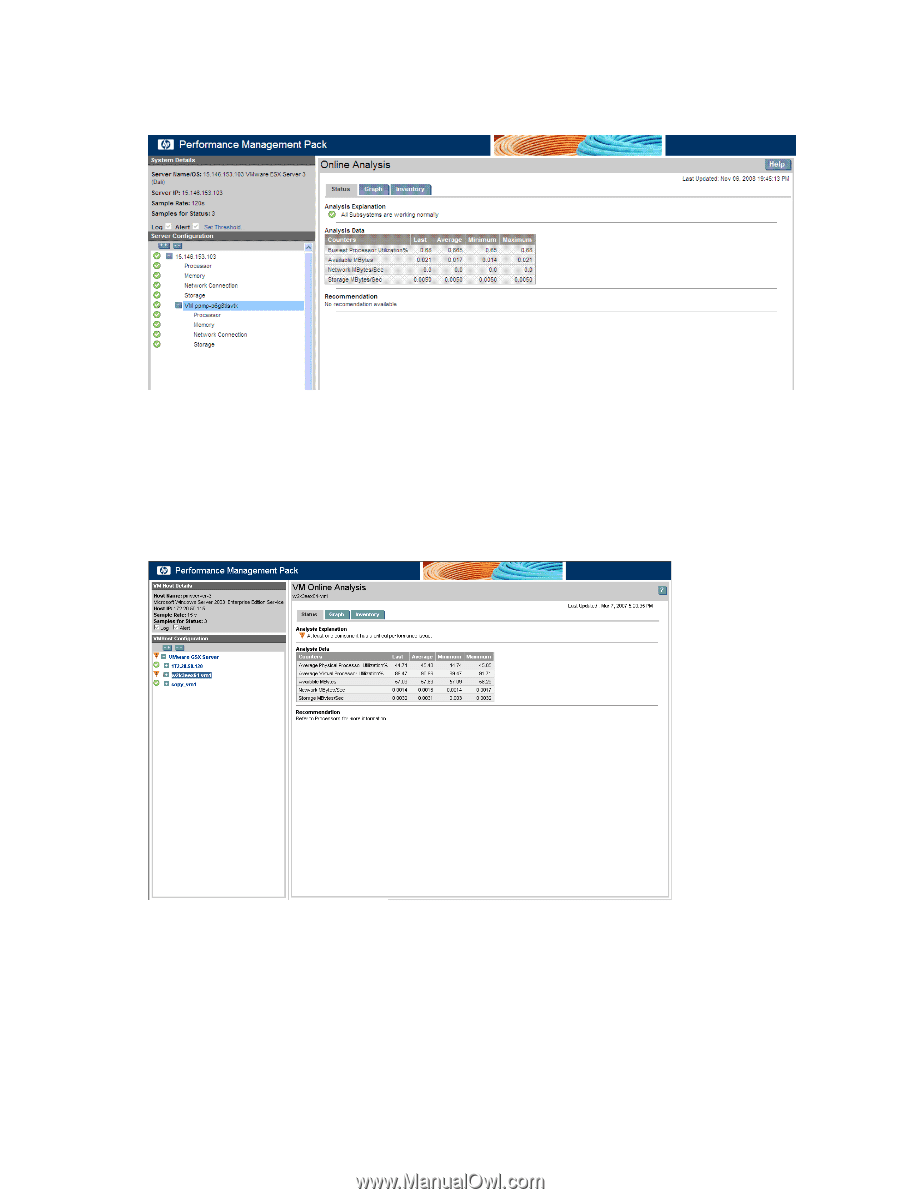
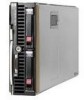
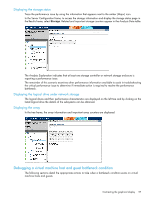
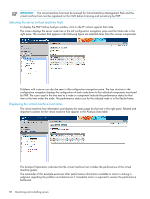
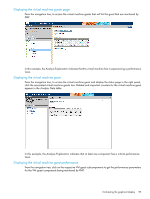
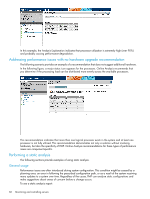
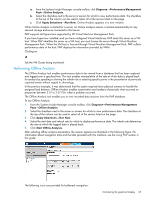
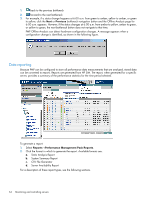
Displaying the virtual machine guests page From the navigation tree, to access the virtual machine guests that will list the guest that are monitored by PMP. In this example, the Analysis Explanation indicates that this virtual machine host is experiencing a performance issue. Displaying the virtual machine guest From the navigation tree, to access the virtual machine guest and display the status page in the right panel, click the associated virtual machine guests tree. Related and important counters for the virtual machine guest appear in the Analysis Data table. In this example, the Analysis Explanation indicates that at least one component has a critical performance issue. Displaying the virtual machine guest performance From the navigation tree, click on the respective VM guest subcomponents to get the performance parameters for the VM guest components being monitored by PMP. Contrasting the graphical display 59
-
 1
1 -
2
-
3
-
4
-
5
-
6
-
7
-
8
-
9
-
10
-
11
-
12
-
13
-
14
-
15
-
16
-
17
-
18
-
19
-
20
-
21
-
22
-
23
-
24
-
25
-
26
-
27
-
28
-
29
-
30
-
31
-
32
-
33
-
34
-
35
-
36
-
37
-
38
-
39
-
40
-
41
-
42
-
43
-
44
-
45
-
46
-
47
-
48
-
49
-
50
-
51
-
52
-
53
-
 54
54 -
 55
55 -
 56
56 -
 57
57 -
 58
58 -
 59
59 -
 60
60 -
 61
61 -
 62
62 -
 63
63 -
 64
64 -
65
-
66
-
67
-
68
-
69
-
70
-
71
-
72
-
73
-
74
-
75
-
76
-
77
-
78
-
79
-
80
-
81
-
82
-
83
-
84
-
85
-
86
-
87
-
88
-
89
-
90
-
91
-
92
-
93
-
94
-
95
-
96
-
97
-
98
-
99
-
100
-
101
-
102
-
103
-
104
-
105
-
106
-
107
-
108
-
109
-
110
-
111
-
112
-
113
-
114
-
115
-
116
-
117
-
118
-
119
-
120
-
121
-
122
-
123
-
124
-
125
-
126
-
127
-
128
-
129
-
130
-
131
-
132
-
133
-
134
-
135
-
136
-
137
-
138
-
139
-
140
-
141
-
142
-
143
-
144
-
145
-
146
-
147
-
148
-
149
-
150
-
151
-
152
-
153
-
154
-
155
-
156
-
157
-
158
-
159
-
160
-
161
-
162
-
163
-
164
-
165
-
166
-
167
-
168
-
169
-
170
-
171
-
172
-
173
-
174
-
175
-
176
-
177
-
178
-
179
-
180
-
181
 |
 |