HP Xw460c HP Insight Control Environment User Guide - Page 48
Results frame, Storage Analysis, PMP Reports
 |
View all HP Xw460c manuals
Add to My Manuals
Save this manual to your list of manuals |
Page 48 highlights
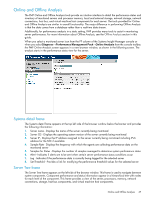
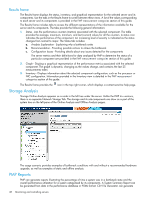
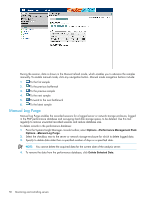
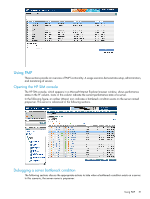
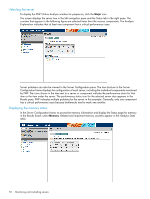
Results frame The Results frame displays the status, inventory, and graphical representation for the selected server and its components. Use the tabs in the Results frame to switch between these views. A list of the values corresponding to each server and its components is provided in the PMP measurement categories section of this guide. The Results frame includes tabs to access the different representations of the information available for the server and its components. The tabs provide the following general information: 1. Status - Lists the performance counters (metrics) associated with the selected component. The table provides the average, maximum, minimum, and last (current) values for all the counters. A status icon indicates the performance of the component. An increasing level of severity is indicated as the status changes from normal to major. The Status tab includes: a. Analysis Explanation - Explaining why a bottleneck exists b. Recommendation - Providing possible actions to relieve the bottleneck c. Configuration Issues - Providing details about any issues detected for the components The server metrics and their definitions for data analyzed by PMP to determine the status of a particular component are provided in the PMP measurement categories section of this guide. 2. Graph - Displays a graphical representation of the performance metrics associated with the selected component. The graph is dynamic, changing as the values change, and contains the last 25 measurements taken. 3. Inventory - Displays information about the selected component configuration, such as the processor or NIC configuration. Information provided in the Inventory view is detailed in the PMP measurement categories section of this guide. The Results frame provides the icon in the top right corner, which displays a context-sensitive help page. Storage Analysis Storage Online Analysis appears as a node in the left tree under the server. Unlike the PMP 4.x versions, there is no separate Network Storage Tab. The storage and its sub-components are show as a part of the system tree on the left pane of the Online Analysis and Offline Analysis pages.. The usage scenario provides examples of bottleneck conditions with and without a recommended hardware upgrade, as well as examples of static and offline analysis. PMP Reports PMP can generate reports illustrating the percentage of time a system was in a bottleneck state and the overall performance utilization for a system categorized by its components. A System Summary Report can be generated from data in the performance database in HTML format. CSV File Generator can generate 48 Monitoring and controlling servers
-
 1
1 -
2
-
3
-
4
-
5
-
6
-
7
-
8
-
9
-
10
-
11
-
12
-
13
-
14
-
15
-
16
-
17
-
18
-
19
-
20
-
21
-
22
-
23
-
24
-
25
-
26
-
27
-
28
-
29
-
30
-
31
-
32
-
33
-
34
-
35
-
36
-
37
-
38
-
39
-
40
-
41
-
42
-
 43
43 -
 44
44 -
 45
45 -
 46
46 -
 47
47 -
 48
48 -
 49
49 -
 50
50 -
 51
51 -
 52
52 -
 53
53 -
54
-
55
-
56
-
57
-
58
-
59
-
60
-
61
-
62
-
63
-
64
-
65
-
66
-
67
-
68
-
69
-
70
-
71
-
72
-
73
-
74
-
75
-
76
-
77
-
78
-
79
-
80
-
81
-
82
-
83
-
84
-
85
-
86
-
87
-
88
-
89
-
90
-
91
-
92
-
93
-
94
-
95
-
96
-
97
-
98
-
99
-
100
-
101
-
102
-
103
-
104
-
105
-
106
-
107
-
108
-
109
-
110
-
111
-
112
-
113
-
114
-
115
-
116
-
117
-
118
-
119
-
120
-
121
-
122
-
123
-
124
-
125
-
126
-
127
-
128
-
129
-
130
-
131
-
132
-
133
-
134
-
135
-
136
-
137
-
138
-
139
-
140
-
141
-
142
-
143
-
144
-
145
-
146
-
147
-
148
-
149
-
150
-
151
-
152
-
153
-
154
-
155
-
156
-
157
-
158
-
159
-
160
-
161
-
162
-
163
-
164
-
165
-
166
-
167
-
168
-
169
-
170
-
171
-
172
-
173
-
174
-
175
-
176
-
177
-
178
-
179
-
180
-
181
 |
 |
