D-Link DES-3528 Product Manual - Page 27
System Log & Trap Settings, Configuration > System Log Configuration > System Log & Trap - user manual
 |
UPC - 790069314346
View all D-Link DES-3528 manuals
Add to My Manuals
Save this manual to your list of manuals |
Page 27 highlights
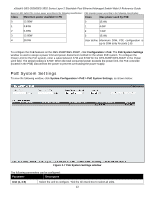
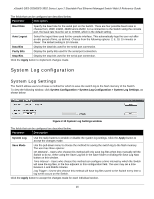
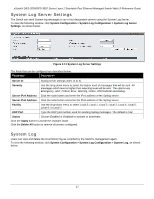
xStack® DES-3528/DES-3552 Series Layer 2 Stackable Fast Ethernet Managed Switch Web UI Reference Guide Figure 2-12 System Log window The Switch can record event information in its own log. Click Go to go to the next page of the System Log window. The fields that can be configured or viewed are described below: Parameter Description Log Type In the drop-down menu the user can select the log type that will be displayed. Severity - When selecting Severity from the drop-down menu, a secondary tick must be made. Secondary ticks are Emergency, Alert, Critical, Error, Warning, Notice, Informational and Debug. To view all information in the log, simply tick the All check box. Module List - When selecting Module List, the module name must be manually entered like MSTP or ERPS. Attack Log - When selecting Attack Log all attacks will be listed. Index A counter incremented whenever an entry to the Switch's history log is made. The table displays the last entry (highest sequence number) first. Time Display the time in days, hours, minutes, and seconds since the Switch was last restarted. Level Display the level of the log entry. Log Text Display text describing the event that triggered the history log entry. Click the Find button to display the log in the display section according to the selection made. Click the Clear Log button to clear the entries from the log in the display section. Click the Clear Attack Log button to clear the entries from the attack log in the display section. System Log & Trap Settings The Switch allows users to configure the system log source IP interface addresses here. To view the following window, click System Configuration > System Log Configuration > System Log & Trap Settings, as shown below: 18
-
 1
1 -
2
-
3
-
4
-
5
-
6
-
7
-
8
-
9
-
10
-
11
-
12
-
13
-
14
-
15
-
16
-
17
-
18
-
19
-
20
-
21
-
 22
22 -
 23
23 -
 24
24 -
 25
25 -
 26
26 -
 27
27 -
 28
28 -
 29
29 -
 30
30 -
 31
31 -
 32
32 -
33
-
34
-
35
-
36
-
37
-
38
-
39
-
40
-
41
-
42
-
43
-
44
-
45
-
46
-
47
-
48
-
49
-
50
-
51
-
52
-
53
-
54
-
55
-
56
-
57
-
58
-
59
-
60
-
61
-
62
-
63
-
64
-
65
-
66
-
67
-
68
-
69
-
70
-
71
-
72
-
73
-
74
-
75
-
76
-
77
-
78
-
79
-
80
-
81
-
82
-
83
-
84
-
85
-
86
-
87
-
88
-
89
-
90
-
91
-
92
-
93
-
94
-
95
-
96
-
97
-
98
-
99
-
100
-
101
-
102
-
103
-
104
-
105
-
106
-
107
-
108
-
109
-
110
-
111
-
112
-
113
-
114
-
115
-
116
-
117
-
118
-
119
-
120
-
121
-
122
-
123
-
124
-
125
-
126
-
127
-
128
-
129
-
130
-
131
-
132
-
133
-
134
-
135
-
136
-
137
-
138
-
139
-
140
-
141
-
142
-
143
-
144
-
145
-
146
-
147
-
148
-
149
-
150
-
151
-
152
-
153
-
154
-
155
-
156
-
157
-
158
-
159
-
160
-
161
-
162
-
163
-
164
-
165
-
166
-
167
-
168
-
169
-
170
-
171
-
172
-
173
-
174
-
175
-
176
-
177
-
178
-
179
-
180
-
181
-
182
-
183
-
184
-
185
-
186
-
187
-
188
-
189
-
190
-
191
-
192
-
193
-
194
-
195
-
196
-
197
-
198
-
199
-
200
-
201
-
202
-
203
-
204
-
205
-
206
-
207
-
208
-
209
-
210
-
211
-
212
-
213
-
214
-
215
-
216
-
217
-
218
-
219
-
220
-
221
-
222
-
223
-
224
-
225
-
226
-
227
-
228
-
229
-
230
-
231
-
232
-
233
-
234
-
235
-
236
-
237
-
238
-
239
-
240
-
241
-
242
-
243
-
244
-
245
-
246
-
247
-
248
-
249
-
250
-
251
-
252
-
253
-
254
-
255
-
256
-
257
-
258
-
259
-
260
-
261
-
262
-
263
-
264
-
265
-
266
-
267
-
268
-
269
-
270
-
271
-
272
-
273
-
274
-
275
-
276
-
277
-
278
-
279
-
280
-
281
-
282
-
283
-
284
-
285
-
286
-
287
-
288
-
289
-
290
-
291
-
292
-
293
-
294
-
295
-
296
-
297
-
298
-
299
-
300
-
301
-
302
-
303
-
304
-
305
-
306
-
307
-
308
-
309
-
310
-
311
-
312
-
313
-
314
-
315
-
316
-
317
-
318
-
319
-
320
-
321
-
322
-
323
-
324
-
325
-
326
-
327
-
328
-
329
-
330
-
331
-
332
-
333
-
334
-
335
-
336
-
337
-
338
-
339
-
340
-
341
-
342
-
343
-
344
-
345
-
346
-
347
-
348
-
349
-
350
-
351
-
352
-
353
-
354
-
355
-
356
-
357
-
358
-
359
-
360
-
361
-
362
-
363
-
364
-
365
-
366
-
367
 |
 |
